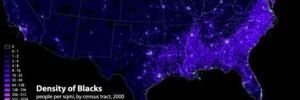
Metro/micro Areas With Largest African American Population
| Blackest Cities in America |
(2020 US Census official count – Black Alone*)
Click on the city name for more details about each city
*SOURCE: U.S. Census Bureau, 2020 Census Redistricting Data (Public Law 94-171), Black Alone= not in combination with other race.
*metropolitan areas include primary city(s) and its suburbs (pop. +50,000)
*micropolitan areas include primary city(s) and surrounding area (pop. 10,000-50,000)
| Metropolitan/micropolitan Area | Black or African American alone | Percent Black |
| 1. New York City, NY-NJ-PA | 3,237,789 | 16% |
| 2. Atlanta, GA | 2,048,212 | 34% |
| 3. Chicago, IL-IN-WI | 1,576,952 | 16% |
| 4. Washington, DC-VA-MD-WV | 1,562,340 | 24% |
| 5. Philadelphia–Wilmington, PA-NJ-DE-MD | 1,273,120 | 20% |
| 6. Houston, TX | 1,237,934 | 17% |
| 7. Dallas–Fort Worth, TX | 1,220,934 | 16% |
| 8. Miami–Fort Lauderdale–West Palm Beach, FL | 1,194,334 | 19% |
| 9. Detroit, MI | 961,076 | 22% |
| 10. Los Angeles, CA | 848,206 | 6% |
| 11. Baltimore, MD | 811,018 | 29% |
| 12. Memphis, TN-MS-AR | 612,104 | 46% |
| 13. Charlotte, NC-SC | 581,927 | 22% |
| 14. Virginia Beach–Norfolk–Newport News, VA-NC | 544,740 | 30% |
| 15. St. Louis, MO-IL | 506,762 | 18% |
| 16. New Orleans, LA | 423,909 | 33% |
| 17. Orlando–Sanford, FL | 410,855 | 15% |
| 18. Cleveland, OH | 410,206 | 20% |
| 19. Tampa–St. Petersburg, FL | 375,855 | 12% |
| 20. Richmond, VA | 364,714 | 28% |
| 21. Boston, MA-NH | 364,054 | 7% |
| 22. Jacksonville, FL | 341,206 | 21% |
| 23. Riverside-San Bernardino-Ontario, CA | 341,035 | 7% |
| 24. Minneapolis–St. Paul, MN-WI | 337,652 | 9% |
| 25. San Francisco–Oakland, CA | 335,135 | 7% |
| 26. Columbus, OH | 334,842 | 16% |
| 27. Birmingham, AL | 328,242 | 29% |
| 28. Indianapolis, IN | 317,192 | 15% |
| 29. Baton Rouge, LA | 302,477 | 35% |
| 30. Las Vegas, NV | 286,684 | 13% |
| 31. Nashville, TN | 284,784 | 14% |
| 32. Jackson, MS | 282,692 | 48% |
| 33. Phoenix, AZ | 282,437 | 6% |
| 34. Cincinnati, OH-KY-IN | 273,322 | 12% |
| 35. Columbia, SC | 269,093 | 32% |
| 36. Kansas City, MO-KS | 262,220 | 12% |
| 37. Raleigh, NC | 258,213 | 18% |
| 38. Milwaukee, WI | 255,992 | 16% |
| 39. Seattle, WA | 246,767 | 6% |
| 40. Augusta, GA-SC | 212,570 | 35% |
| 41. Greensboro–High Point, NC | 207,385 | 27% |
| 42. Pittsburgh, PA | 199,469 | 8% |
| 43. Louisville, KY-IN | 189,663 | 15% |
| 44. Charleston, SC | 183,724 | 23% |
| 45. San Antonio, TX | 181,016 | 7% |
| 46. Little Rock, AR | 173,297 | 23% |
| 47. Fayetteville, NC | 171,793 | 33% |
| 48. Sacramento, CA | 167,386 | 7% |
| 49. Montgomery, AL | 167,315 | 43% |
| 50. Denver, CO | 166,100 | 6% |
| 51. Durham, NC | 162,744 | 25% |
| 52. Austin, TX | 160,079 | 7% |
| 53. San Diego, CA | 155,813 | 5% |
| 54. Shreveport, LA | 155,018 | 39% |
| 55. Buffalo–Niagara Falls, NY | 151,535 | 13% |
| 56. Mobile, AL | 149,572 | 35% |
| 57. Oklahoma City, OK | 146,494 | 10% |
| 58. Greenville, SC | 143,173 | 15% |
| 59. Hartford, CT | 141,209 | 12% |
| 60. Columbus, GA-AL | 136,849 | 42% |
| 61. Dayton, OH | 127,807 | 16% |
| 62. Rochester, NY | 127,406 | 12% |
| 63. Savannah, GA | 124,644 | 31% |
| 64. Tallahassee, FL | 121,168 | 32% |
| 65. New Haven-Milford, CT | 118,933 | 14% |
| 66. Lafayette, LA | 117,267 | 25% |
| 67. Winston-Salem, NC | 116,597 | 17% |
| 68. Bridgeport-Stamford-Norwalk, CT | 106,756 | 11% |
| 69. Lakeland-Winter Haven, FL | 105,533 | 15% |
| 70. Huntsville, AL | 105,373 | 21% |
| 71. Macon, GA | 104,157 | 45% |
| 72. Killeen-Temple, TX | 98,338 | 21% |
| 73. Beaumont-Port Arthur, TX | 95,988 | 24% |
| 74. Tuscaloosa, AL | 91,160 | 34% |
| 75. Gulfport-Biloxi, MS | 88,986 | 21% |
| 76. Toledo, OH | 88,878 | 14% |
| 77. Providence, RI-MA | 87,836 | 5% |
| 78. Akron, OH | 87,763 | 12% |
| 79. Florence, SC | 82,710 | 41% |
| 80. Tulsa, OK | 80,459 | 8% |
| 81. Pensacola, FL | 80,013 | 16% |
| 82. Flint, MI | 79,914 | 20% |
| 83. Albany, GA | 78,201 | 53% |
| 84. Poughkeepsie-Newburgh-Middletown, NY | 77,832 | 11% |
| 85. Albany, NY | 77,752 | 9% |
| 86. Monroe, LA | 76,126 | 37% |
| 87. Portland, OR-WA | 76,054 | 3% |
| 88. Grand Rapids, MI | 75,342 | 7% |
| 89. Trenton, NJ | 74,993 | 19% |
| 90. Omaha, NE-IA | 74,428 | 8% |
| 91. Port St. Lucie, FL | 73,989 | 15% |
| 92. Chattanooga, TN-GA | 70,418 | 13% |
| 93. Salisbury, MD-DE | 69,088 | 17% |
| 94. Deltona-Daytona Beach, FL | 68,724 | 10% |
| 95. Warner Robins, GA | 64,829 | 34% |
| 96. Rocky Mount, NC | 64,387 | 45% |
| 97. Spartanburg, SC | 64,230 | 20% |
| 98. Sumter, SC | 62,795 | 46% |
| 99. Harrisburg, PA | 62,251 | 11% |
| 100. Vallejo-Fairfield, CA | 62,157 | 14% |
| 101. Clarksville, TN-KY | 61,220 | 19% |
| 102. Greenville, NC | 60,414 | 35% |
| 103. Stockton-Lodi, CA | 60,351 | 8% |
| 104. Syracuse, NY | 59,651 | 9% |
| 105. Cape Coral-Fort Myers, FL | 58,916 | 8% |
| 106. Palm Bay-Melbourne-Titusville, FL | 58,692 | 10% |
| 107. Youngstown-Warren, OH-PA | 58,424 | 11% |
| 108. Lexington-Fayette, KY | 57,248 | 11% |
| 109. Gainesville, FL | 56,647 | 17% |
| 110. Lake Charles, LA | 55,335 | 25% |
| 111. Allentown-Bethlehem-Easton, PA-NJ | 54,138 | 6% |
| 112. Valdosta, GA | 52,478 | 35% |
| 113. Myrtle Beach-Conway, SC-NC | 51,429 | 11% |
| 114. Hattiesburg, MS | 51,215 | 30% |
| 115. Orangeburg, SC (micro area) | 51,046 | 61% |
| 116. Worcester, MA-CT | 50,425 | 5% |
| 117. Bakersfield, CA | 50,130 | 6% |
| 118. Longview, TX | 50,128 | 18% |
| 119. Knoxville, TN | 49,920 | 6% |
| 120. North Port-Sarasota-Bradenton, FL | 48,902 | 6% |
| 121. Wichita, KS | 48,849 | 8% |
| 122. Fresno, CA | 48,707 | 5% |
| 123. Jackson, TN | 48,349 | 27% |
| 124. Springfield, MA | 47,337 | 7% |
| 125. Dover, DE | 46,998 | 26% |
| 126. San Jose-Santa Clara, CA | 45,600 | 2% |
| 127. Lansing, MI | 45,308 | 8% |
| 128. Fort Wayne, IN | 44,643 | 11% |
| 129. Ocala, FL | 44,411 | 12% |
| 130. Colorado Springs CO | 43,957 | 6% |
| 131. Alexandria, LA | 43,592 | 29% |
| 132. Ann Arbor, MI | 42,819 | 12% |
| 133. Meridian, MS (micro area) | 42,743 | 44% |
| 134. Lynchburg, VA | 42,504 | 16% |
| 135. Pine Bluff, AR | 42,173 | 48% |
| 136. Atlantic City, NJ | 41,519 | 15% |
| 137. Waco, TX | 41,310 | 15% |
| 138. Rockford, IL | 40,404 | 12% |
| 139. Hammond, LA | 40,039 | 30% |
| 140. Roanoke, VA | 40,035 | 13% |
| 141. Tucson, AZ | 39,954 | 4% |
| 142. Auburn-Opelika, AL | 39,570 | 23% |
| 143. Des Moines, IA | 39,565 | 6% |
| 144. Athens, GA | 38,610 | 18% |
| 145. Tyler, TX | 38,593 | 17% |
| 146. South Bend, IN-MI | 38,444 | 12% |
| 147. LaGrange, GA-AL (micro area) | 37,799 | 36% |
| 148. Hilton Head Island-Beaufort, SC | 37,618 | 17% |
| 149. Peoria, IL | 37,207 | 9% |
| 150. Texarkana, TX-AR | 36,417 | 25% |
| 151. Houma-Thibodaux, LA | 35,893 | 17% |
| 152. Goldsboro, NC | 35,795 | 31% |
| 153. Wilmington, NC | 35,005 | 12% |
| 154. Dothan, AL | 34,897 | 23% |
| 155. Saginaw, MI | 34,615 | 18% |
| 156. Roanoke Rapids, NC (micro area) | 34,535 | 52% |
| 157. Opelousas, LA (micro area) | 34,360 | 42% |
| 158. Danville, VA (micro area) | 34,296 | 33% |
| 159. Burlington, NC | 34,014 | 20% |
| 160. Tupelo, MS (micro area) | 33,667 | 21% |
| 161. Hinesville, GA | 32,220 | 40% |
| 162. Greenville, MS (micro area) | 32,042 | 71% |
| 163. Davenport-Moline-Rock Island, IA-IL | 31,879 | 8% |
| 164. Madison, WI | 31,704 | 5% |
| 165. Kalamazoo-Portage, MI | 30,352 | 12% |
| 166. Wilson, NC (micro area) | 30,097 | 38% |
| 167. College Station-Bryan, TX | 29,425 | 11% |
| 168. Canton-Massillon, OH | 29,240 | 7% |
| 169. El Paso, TX | 29,070 | 3% |
| 170. Champaign-Urbana, IL | 28,758 | 13% |
| 171. Vineland-Bridgeton, NJ | 28,581 | 19% |
| 172. Jacksonville, NC | 28,026 | 14% |
| 173. York-Hanover, PA | 27,999 | 6% |
| 174. Laurel, MS (micro area) | 27,580 | 33% |
| 175. Lubbock, TX | 27,537 | 9% |
| 176. Hagerstown-Martinsburg, MD-WV | 27,167 | 9% |
| 177. Selma, AL (micro area) | 26,899 | 70% |
| 178. Talladega-Sylacauga, AL (micro area) | 26,439 | 32% |
| 179. Lumberton, NC (micro area) | 26,424 | 23% |
| 180. Springfield, IL | 26,042 | 12% |
| 181. Columbus, MS (micro area) | 25,997 | 44% |
| 182. Albuquerque, NM | 25,777 | 3% |
| 183. Anniston-Oxford-Jacksonville, AL | 25,559 | 22% |
| 184. East Stroudsburg, PA | 24,894 | 15% |
| 185. New Bern, NC | 24,844 | 20% |
| 186. Scranton-Wilkes-Barre-Hazleton, PA | 24,809 | 4% |
| 187. Brunswick, GA | 24,436 | 22% |
| 188. Milledgeville, GA (micro area) | 24,432 | 47% |
| 189. Natchez, MS-LA (micro area) | 24,303 | 50% |
| 190. Greenwood, MS (micro area) | 23,939 | 62% |
| 191. Salt Lake City, UT | 23,939 | 2% |
| 192. Muskegon, MI | 23,908 | 14% |
| 193. Charlottesville, VA | 23,790 | 11% |
| 194. Hickory-Lenoir-Morganton, NC | 23,535 | 6% |
| 195. Dublin, GA (micro area) | 23,388 | 36% |
| 196. Naples-Immokalee-Marco Island, FL | 23,349 | 6% |
| 197. Racine, WI | 23,303 | 12% |
| 198. Statesboro, GA (micro area) | 23,052 | 28% |
| 199. Crestview-Fort Walton Beach-Destin, FL | 22,999 | 8% |
| 200. Evansville, IN-KY | 22,588 | 7% |
| 201. Lancaster, PA | 22,394 | 4% |
| 202. Kinston, NC (micro area) | 22,195 | 40% |
| 203. Reading, PA | 21,992 | 5% |
| 204. McComb, MS (micro area) | 21,562 | 53% |
| 205. Niles-Benton Harbor, MI | 21,420 | 14% |
| 206. Vicksburg, MS (micro area) | 21,417 | 48% |
| 207. Henderson, NC (micro area) | 21,237 | 50% |
| 208. Greenwood, SC (micro area) | 20,938 | 30% |
| 209. Urban Honolulu, HI | 20,723 | 2% |
| 210. Erie, PA | 20,584 | 8% |
| 211. Jonesboro, AR | 20,256 | 15% |
| 212. Shelby, NC (micro area) | 20,159 | 20% |
| 213. Starkville, MS (micro area) | 20,115 | 33% |
| 214. Lawton, OK | 19,878 | 16% |
| 215. Asheville, NC | 19,577 | 4% |
| 216. Columbia, MO | 19,566 | 9% |
| 217. Cleveland, MS (micro area) | 19,365 | 62% |
| 218. Decatur, IL | 19,047 | 18% |
| 219. Decatur, AL | 18,757 | 12% |
| 220. Ruston, LA (micro area) | 18,729 | 39% |
| 221. Florence-Muscle Shoals, AL | 18,529 | 12% |
| 222. Daphne-Fairhope-Foley, AL | 18,217 | 8% |
| 223. Indianola, MS (micro area) | 18,164 | 70% |
| 224. Georgetown, SC (micro area) | 18,156 | 29% |
| 225. Panama City, FL | 17,856 | 10% |
| 226. Amarillo, TX | 17,621 | 7% |
| 227. Martinsville, VA (micro area) | 17,254 | 27% |
| 228. Elizabeth City, NC (micro area) | 17,193 | 32% |
| 229. Cedar Rapids, IA | 17,004 | 6% |
| 230. Utica-Rome, NY | 16,943 | 6% |
| 231. Huntsville, TX (micro area) | 16,638 | 22% |
| 232. Thomasville, GA (micro area) | 16,343 | 36% |
| 233. California-Lexington Park, MD | 16,294 | 14% |
| 234. Clarksdale, MS (micro area) | 16,281 | 76% |
| 235. Fargo, ND-MN | 16,153 | 6% |
| 236. Norwich-New London, CT | 16,026 | 6% |
| 237. Americus, GA (micro area) | 15,997 | 47% |
| 238. Modesto, CA | 15,913 | 3% |
| 239. Anchorage, AK | 15,697 | 4% |
| 240. Kankakee, IL | 15,573 | 14% |
| 241. Corpus Christi, TX | 15,504 | 4% |
| 242. St. Cloud, MN | 15,337 | 8% |
| 243. Oxnard-Thousand Oaks-Ventura, CA | 15,330 | 2% |
| 244. Gadsden, AL | 15,146 | 15% |
| 245. Morgan City, LA (micro area) | 15,058 | 30% |
| 246. Bloomington, IL (micro area) | 14,996 | 9% |
| 247. Natchitoches, LA (micro area) | 14,948 | 40% |
| 248. Gainesville, GA | 14,660 | 7% |
| 249. Portland-South Portland, ME | 14,532 | 3% |
| 250. Battle Creek, MI | 14,513 | 11% |
| 251. Topeka, KS | 14,481 | 6% |
| 252. Blytheville, AR (micro area) | 14,323 | 35% |
| 253. Elizabethtown-Fort Knox, KY | 14,189 | 9% |
| 254. Rome, GA | 14,087 | 14% |
| 255. Waterloo-Cedar Falls, IA | 13,964 | 8% |
| 256. Wichita Falls, TX | 13,958 | 9% |
| 257. Abilene, TX | 13,928 | 8% |
| 258. Charleston, WV | 13,890 | 5% |
| 259. Lincoln, NE | 13,864 | 4% |
| 260. Fayetteville-Springdale-Rogers, AR | 13,425 | 2% |
| 261. Alexander City, AL (micro area) | 13,417 | 26% |
| 262. Bennettsville, SC (micro area) | 13,391 | 50% |
| 263. Sebastian-Vero Beach, FL | 13,367 | 8% |
| 264. Bowling Green, KY | 13,250 | 7% |
| 265. Douglas, GA (micro area) | 13,185 | 26% |
| 266. Laurinburg, NC (micro area) | 13,162 | 39% |
| 267. Binghamton, NY | 13,136 | 5% |
| 268. Lufkin, TX (micro area) | 13,098 | 15% |
| 269. Iowa City, IA | 13,035 | 7% |
| 270. Rockingham, NC (micro area) | 12,881 | 30% |
| 271. Bogalusa, LA (micro area) | 12,858 | 28% |
| 272. Eufaula, AL-GA (micro area) | 12,852 | 47% |
| 273. El Dorado, AR (micro area) | 12,729 | 33% |
| 274. Sioux Falls, SD | 12,705 | 5% |
| 275. Jackson, MI | 12,632 | 8% |
| 276. Lima, OH | 12,573 | 12% |
| 277. Forrest City, AR (micro area) | 12,561 | 54% |
| 278. Ponce, PR | 12,488 | 6% |
| 279. Waycross, GA (micro area) | 12,371 | 22% |
| 280. Reno, NV | 12,319 | 3% |
| 281. Bainbridge, GA (micro area) | 12,241 | 42% |
| 282. Springfield, OH (micro area) | 12,200 | 9% |
| 283. Minden, LA (micro area) | 12,185 | 33% |
| 284. Troy, AL (micro area) | 12,138 | 37% |
| 285. Tifton, GA (micro area) | 12,131 | 29% |
| 286. Michigan City-La Porte, IN | 12,090 | 11% |
| 287. Carbondale-Marion, IL | 11,899 | 9% |
| 288. Manhattan, KS | 11,600 | 9% |
| 289. Lake City, FL (micro area) | 11,593 | 17% |
| 290. Palestine, TX (micro area) | 11,577 | 20% |
| 291. Rochester, MN | 11,470 | 5% |
| 292. Lafayette-West Lafayette, IN | 11,466 | 5% |
| 293. Palatka, FL (micro area) | 11,444 | 16% |
| 294. Oxford, MS (micro area) | 11,381 | 20% |
| 295. Elkhart-Goshen, IN | 11,372 | 5% |
| 296. Gaffney, SC (micro area) | 11,370 | 20% |
| 297. Springfield, MO | 11,345 | 2% |
| 298. Mansfield, OH | 11,312 | 9% |
| 299. Aguadilla-Isabela, PR | 11,156 | 4% |
| 300. Midland, TX | 11,136 | 6% |
| 301. Spokane-Spokane Valley, WA | 11,128 | 2% |
| 302. Kingston, NY | 11,063 | 6% |
| 303. Atmore, AL (micro area) | 10,991 | 30% |
| 304. Manchester-Nashua, NH | 10,937 | 3% |
| 305. Sanford, NC (micro area) | 10,885 | 17% |
| 306. West Point, MS (micro area) | 10,803 | 58% |
| 307. Nacogdoches, TX (micro area) | 10,709 | 17% |
| 308. Pinehurst-Southern Pines, NC (micro area) | 10,671 | 11% |
| 309. Brookhaven, MS (micro area) | 10,542 | 30% |
| 310. Newberry, SC (micro area) | 10,451 | 28% |
| 311. Danville, IL | 10,421 | 14% |
| 312. Jefferson City, MO | 10,403 | 7% |
| 313. Helena-West Helena, AR (micro area) | 10,343 | 62% |
| 314. Washington, NC (micro area) | 10,303 | 23% |
| 315. Ozark, AL (micro area) | 10,241 | 21% |
| 316. Moultrie, GA (micro area) | 10,068 | 22% |
| 317. Salinas, CA | 9,943 | 2% |
| 318. Sebring-Avon Park, FL | 9,891 | 10% |
| 319. Camden, AR (micro area) | 9,812 | 36% |
| 320. Boise City, ID | 9,773 | 1% |
| 321. St. Marys, GA (micro area) | 9,697 | 18% |
| 322. Fort Smith, AR-OK | 9,653 | 4% |
| 323. Grenada, MS (micro area) | 9,409 | 44% |
| 324. Olympia-Lacey-Tumwater, WA | 9,403 | 3% |
| 325. Punta Gorda, FL | 9,268 | 5% |
| 326. Merced, CA | 9,158 | 3% |


