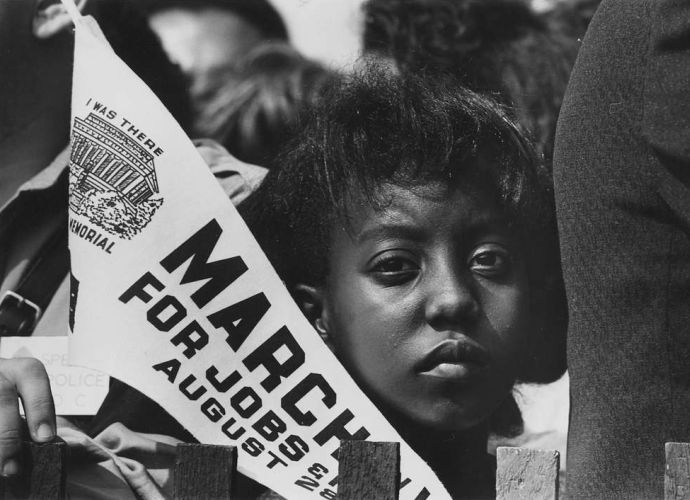
Poverty in Black America
Black Family Poverty Rates (Black vs Total)
Black Family Poverty Rates

In the 2024 ACS, Black families have a substantially higher poverty rate than the U.S. overall. Poverty is especially elevated among families with children and female-householder families without a spouse present, where rates are roughly one-third or higher—well above the national averages in the same categories. This is significant considering more than half of all Black families with children are headed by single women.
Black Individual Poverty Rates (Black vs Total)
Black Individual Poverty Rates
In the 2024 ACS, Black individuals experience higher poverty rates than the total U.S. population across every age group. The gap is largest for children under 18, where Black child poverty is markedly higher than the national rate, highlighting how poverty burden is disproportionately concentrated among Black youth. The poverty rate for working-age African Americans is 17% (ages between 18 to 64 years old.)
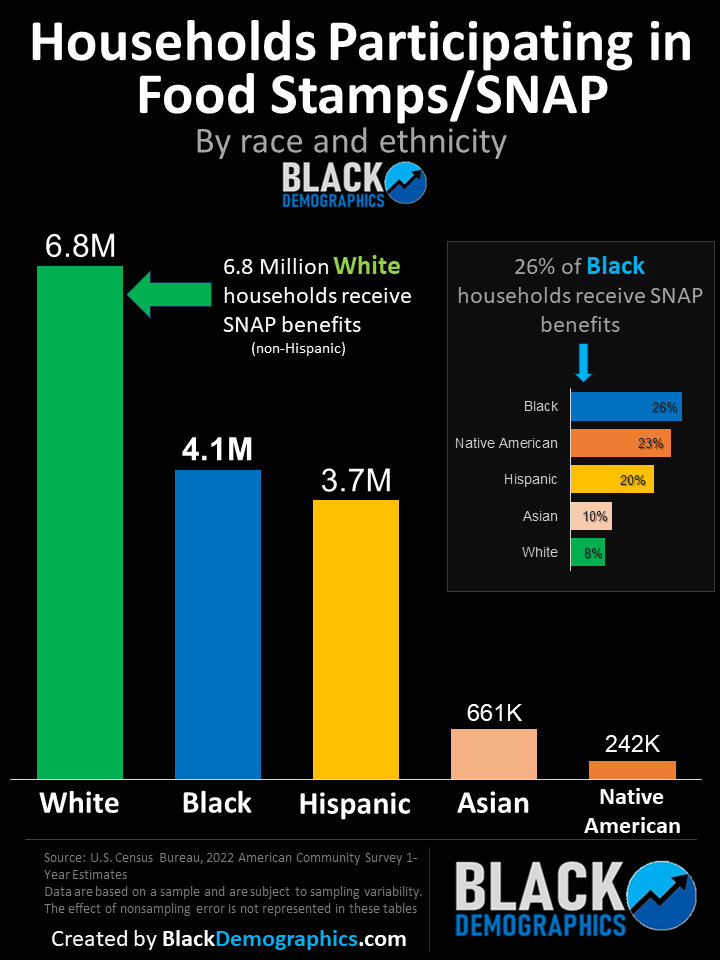
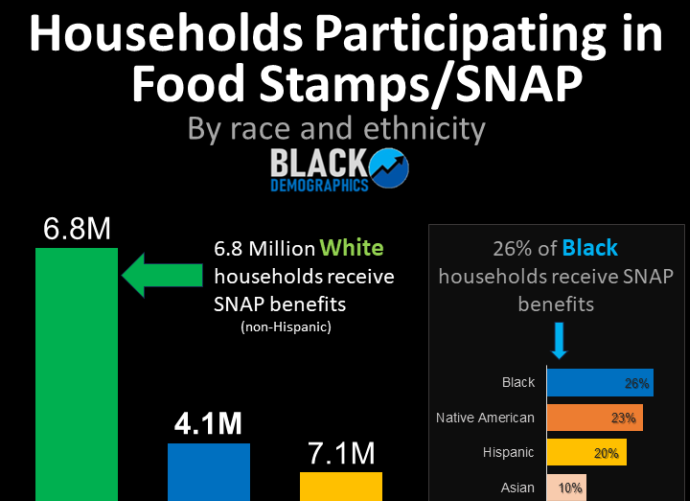
Despite running stereotypes that associate African Americans as being the primary consumers of the SNAP program formerly known as and commonly referred to as the Food Stamp program, White Americans are actually the primary benefactors of this program. In 2022 there were 4.1 million African American households participating in SNAP/Food Stamps (24%) compared to 6.8 million White households who make up largest percent of total households using SNAP/Food Stamps. However, when adjusted for population Black households do use SNAP/Food Stamps at a higher rate. This also means that contrary to similar stereotypical narratives the majority of Black households do not use SNAP/Food Stamps.
History of Poverty in Black American Families
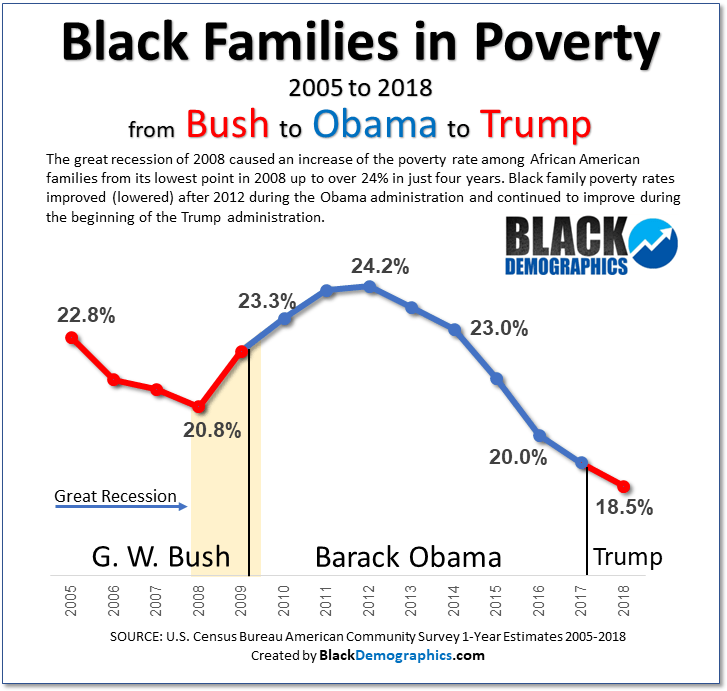
The U.S. Census Bureau records historical poverty data among American families using its Current Population Survey and Annual Social and Economic Supplements (chart below). In 1967 about one third (33.9%) of all Black families lived below the poverty level compared to only 11% of all families in America . By 1990 the disparity gap between the two remained virtually the same despite a slight decrease in the overall poverty rate for both population groups. During the decade of the 1990s while the nation was experiencing an economic boom the poverty rate of Black families dropped from 29% in 1990 to 19% in 2000 virtually cutting the disparity in half. The economic downturn in the decade from 2000 to 2010 caused the increase of the Black family poverty rate to 24%. Since 2010 the Black family poverty rate began to decrease sightly reaching 23% in 2014, however the disparity has remained relatively unchanged since 2000.
In 1967 more than a half (56%) of Black families headed by single women lived below the national poverty level compared to 33% of all families in America headed by single women. During the decade of the 1990s the poverty rate of families headed by Black single mothers dropped from 48% in 1990 to its lowest point (34%) in 2000. The economic downturn in the decade from 2000 to 2010 increased the Black family poverty rate to 39% by 2010. Since 2010 the Black family poverty rate decreased sightly to 37% by 2014. Although the actual disparity between Black single mother families and all single mother families has always been lower than that between all family types the adjustments (increases and decreases) in disparity over the decades have been fairly similar.
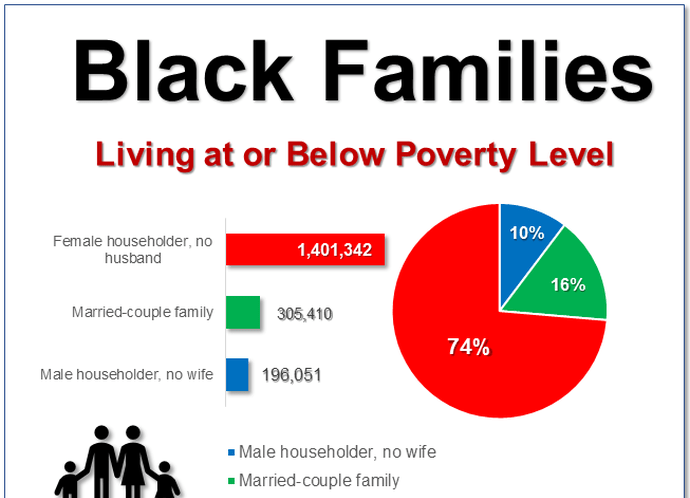
As the chart below shows when considering Black families with and without children who live below the national poverty line the vast majority (74% or 1.4 million) are headed by single women and just 16% are headed by a married-couple family. Only 10% are headed by a single father.
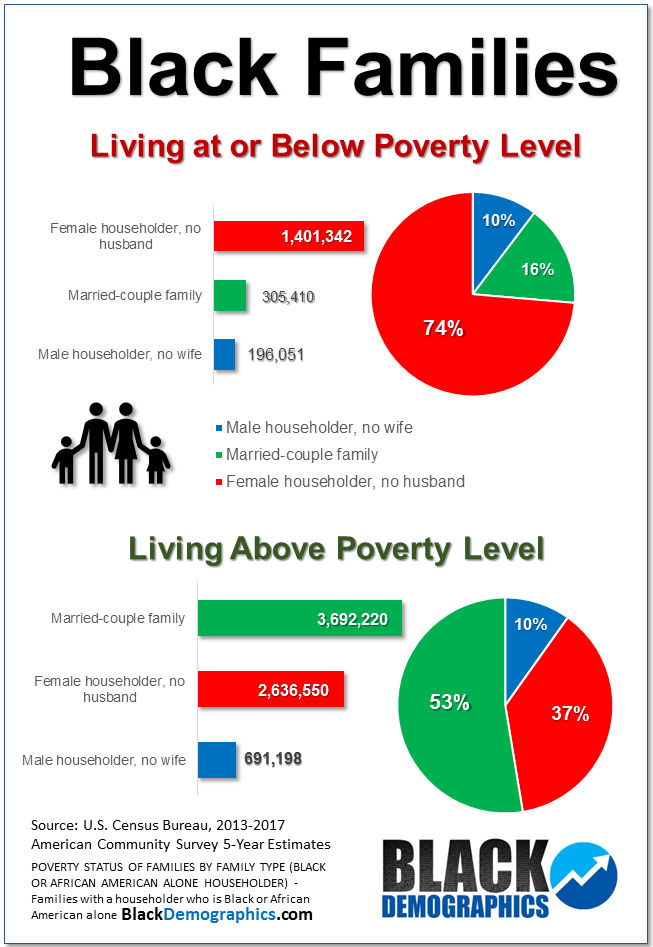
When considering Black families who live above the national poverty line the more than half (53% or 3.7 million) are headed by married couples and just 37% (2.6 million) are headed by a single women. Only 10% of Black families are headed by a single man.
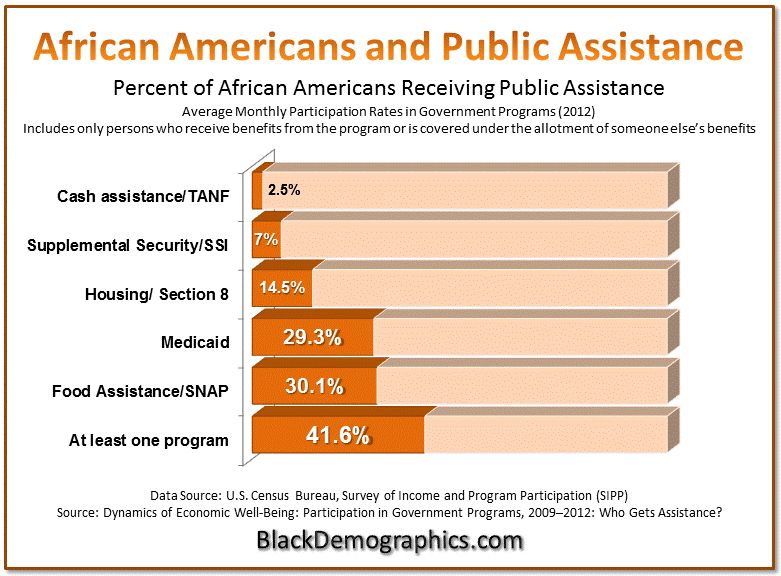
Public Assistance
The amount of African Americans who receive public assistance varies greatly depending on the type of assistance. According to the U.S. Census Bureau 14.5% of African Americans receive housing assistance including government housing or section 8 housing while 2.5% receive TANF cash assistance (formerly referred to as welfare checks). All of these statistics include those who receive benefits or those covered under the allotment of someone else’s benefits which does not always include everyone who lives in the household. The largest benefits received by African Americans include the 29% receiving Medicaid health insurance and 30% of African Americans who receive SNAP benefits (Food Stamps). About 42% of African Americans (largely children) received some sort of public assistance.
POVERTY RELATED ARTICLES
Debunking Myths: The Real Picture of Food Stamp Participation in America
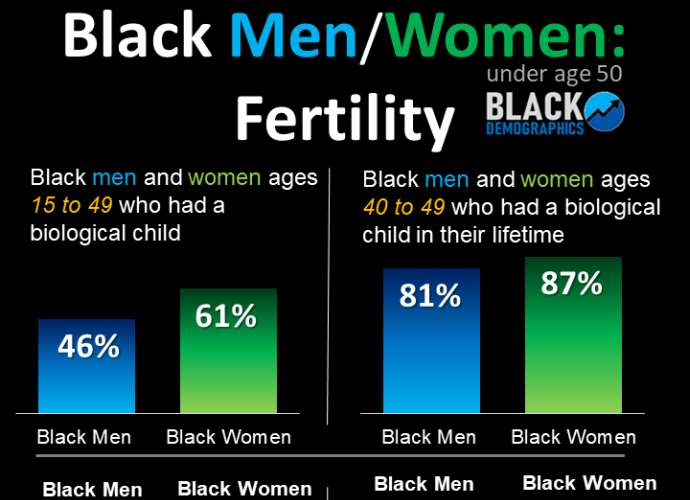
Exploring Black Fertility and Family Trends
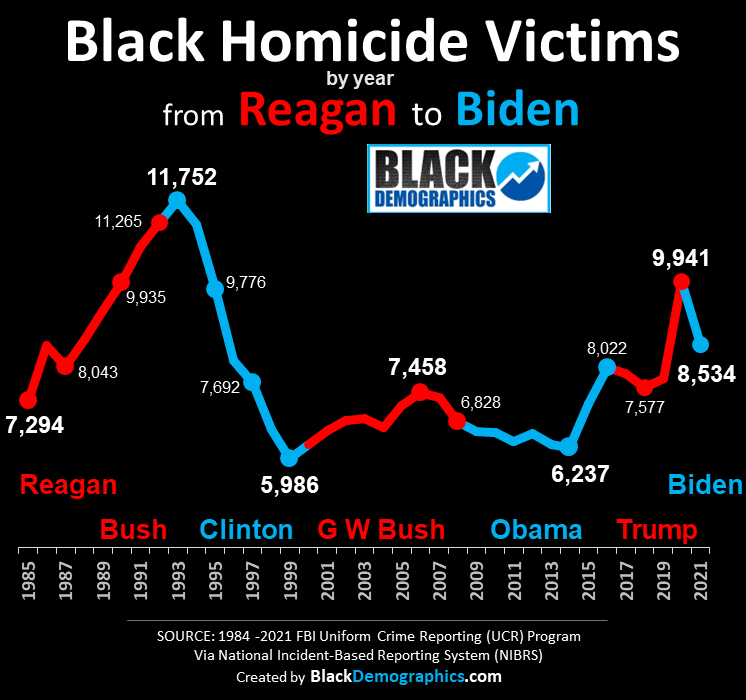
DATA CHART: Black Homicides from Reagan to Biden

First Fired: Black Workers Make up 90% of Recent Job Loses
DATA CHART: African American Income from Truman to Trump (1948-2021)

Black/White Wealth Gap Persists
DATA CHART: Black Families Above and Below Poverty Level
Chart: History of Poverty in Black American Families