 Elementary & High School Education
According to the U.S. Department of Education there where 8,166,353 Black children attending public school and 430,972 in private schools in the United States during the 2009-2010 school year. Of those in public school 488,233 are enrolled in charter school meaning there are now more African American children in charter schools than private schools.
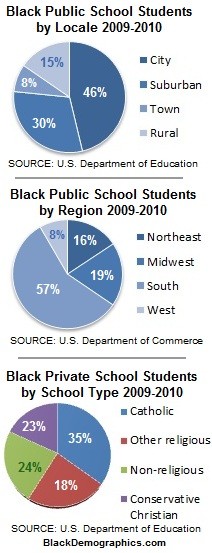
Of the more than 8 million Black public school students, 76 percent attend schools inside urbanized areas which include both city and suburban districts. Fifteen percent are in Towns which are defined as built up areas outside of urbanized areas with populations of less than 50,000 and greater than 2,500. More than half (57%) of Black public school children live in the South which is only slightly higher than the percentage of African Americans in the south as a whole (55%).
Private Schools
A large majority (75%) of African American private school students attend religious schools. The largest group, 35% are enrolled in Catholic schools which is interesting since only 5% of African Americans consider themselves Catholic. This has more to do with the fact that Catholic schools are usually the most affordable alternative to public schools. The 18% that make up the ‘Other religious’ category consist of non-conservative Christian groups as well as Jewish, Islamic, and other religions.
Charter Schools
The charter school movement has been growing nationwide for more than a decade. These schools are responsible for educating a growing number of the African American student population. During the 2009-2010 school year there were 488,233 African Americans attending charter schools compared to 113,792 during the 1999-2000 school year. Despite the media focus on Black inner city communities just over half of charter schools are located in cities and only 30% of charter school students are Black.
 Graduation VS Dropping Out
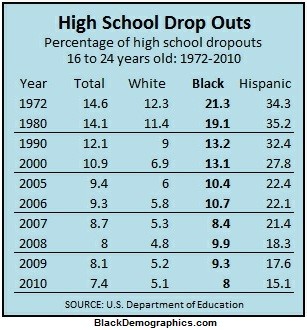
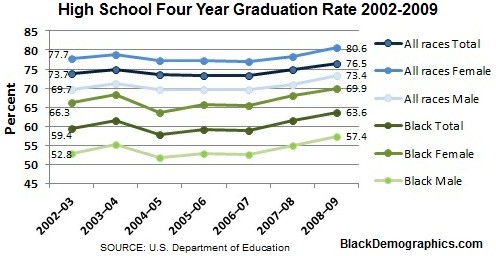
An increasing number of African American students are graduating high school. There is some confusion when only looking at the 4-year graduation rates which show the Black graduation rate at only 63.6% compared to the U.S. graduation rate of 80.6%. But when looking at the dropout rate one can see that only 8% of African American children dropped out of high school in 2010 compared to 7.4% of all children. This continues a long downward trend once at 21.3% in 1972 and 13.1% in 2000.
The White dropout rate was 5.1% in 2010. However, this does mean that a larger percentage of Black students are taking more than four years to finish high school.
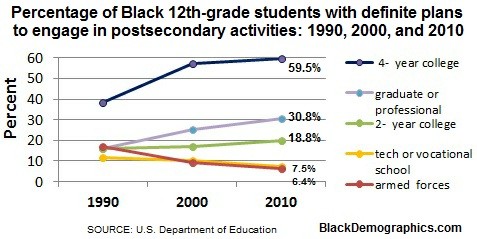
Black Student Ambition
African American high school seniors are planning to attend colleges and universities in increasing numbers and looking to technical schools and military service less since 1990. The number of Black seniors who had definite plans to attend a four year college doubled between 1990 to 2010 from 30% to 60%. Those who had plans to go on to a graduate or professional school also doubled during the same time period. During the same time plans to attend a two year college only increased slightly from 16% to 19%.
Mathematics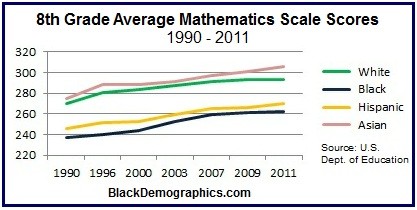
Although African American 8th graders have bridged the Black-White gap by some in the last thirty years there remains a disparity. When looking at the 8th grade mathematics scale scores between 1990 and 2011 there is a 7 point decrease in the gap from 32 points to 25 points.
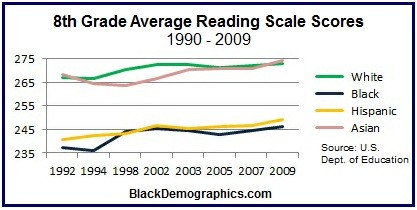 Reading
A similar decrease is seen with 8th grade reading scores between 1992 and 2009. Here the Black-White gap decrease was one point higher changing from 32 points to 24 points.
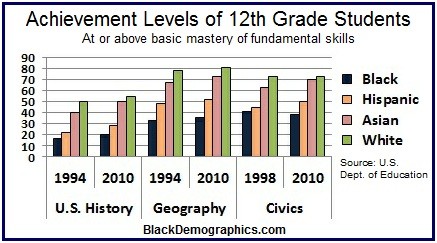 History, Geography, & Civics
The chart below covers U.S. History, Geography, and Civics classes and displays the percentage of students who are at or above basic mastery of fundamental skills. Improvements in these subjects between 1994 and 2010 changed very little for children of all races and ethnic backgrounds even decreasing for Whites and Blacks in Civics. But as the chart shows African Americans still lag behind all other groups.
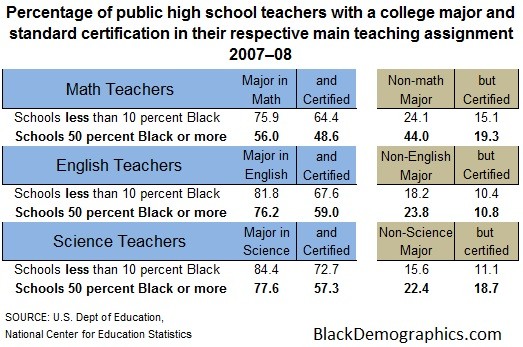
Teachers in Black Schools
Majority Black public schools have fewer certified teachers with degrees in the subjects they teach. For example in non-Black public schools more than 75% of math teachers had math as their major in college as apposed to 56% of teachers in majority Black schools. And of that 56% fewer were certified. Smaller disparities exist with English and science teachers, however it is still apparent.