

Ranking of 133 Metropolitan Areas with Black population over 50,000 population
Source: U.S. Census Bureau, Population estimates change from July, 1, 2020 to July 1, 2023, Division Release date: June 2024
| Rank | Metro Area | 2020 | 2023 | Change +/- |
|---|---|---|---|---|
| 1 | Dallas-Fort Worth-Arlington, TX | 1,309,385 | 1,438,540 | 129,155 |
| 2 | Atlanta-Sandy Springs-Roswell, GA | 2,160,589 | 2,287,049 | 126,460 |
| 3 | Houston-Pasadena-The Woodlands, TX | 1,323,709 | 1,438,216 | 114,507 |
| 4 | Charlotte-Concord-Gastonia, NC-SC | 631,933 | 674,918 | 42,985 |
| 5 | Phoenix-Mesa-Chandler, AZ | 316,810 | 350,463 | 33,653 |
| 6 | Orlando-Kissimmee-Sanford, FL | 490,007 | 522,962 | 32,955 |
| 7 | Tampa, FL | 319,242 | 351,154 | 31,912 |
| 8 | Minneapolis-St. Paul-Bloomington, MN-WI | 349,714 | 380,206 | 30,492 |
| 9 | Tampa-St. Petersburg-Clearwater, FL | 426,048 | 456,063 | 30,015 |
| 10 | Las Vegas-Henderson-North Las Vegas, NV | 302,585 | 327,804 | 25,219 |
| 11 | Columbus, OH | 356,563 | 381,490 | 24,927 |
| 12 | Indianapolis-Carmel-Greenwood, IN | 335,412 | 359,212 | 23,800 |
| 13 | Lakeland-Winter Haven, FL | 119,377 | 142,057 | 22,680 |
| 14 | Austin-Round Rock-San Marcos, TX | 186,699 | 208,614 | 21,915 |
| 15 | Raleigh-Cary, NC | 290,419 | 311,214 | 20,795 |
| 16 | San Antonio-New Braunfels, TX | 206,778 | 226,874 | 20,096 |
| 17 | Jacksonville, FL | 361,521 | 379,876 | 18,355 |
| 18 | Providence-Warwick, RI-MA | 133,051 | 149,629 | 16,578 |
| 19 | Seattle-Tacoma-Bellevue, WA | 265,684 | 282,177 | 16,493 |
| 20 | Port St. Lucie, FL | 80,823 | 96,616 | 15,793 |
| 21 | Columbia, SC | 288,509 | 301,371 | 12,862 |
| 22 | Baltimore-Columbia-Towson, MD | 853,672 | 866,020 | 12,348 |
| 23 | Wilmington, DE-MD-NJ | 169,200 | 180,572 | 11,372 |
| 24 | Boston-Cambridge-Newton, MA-NH | 482,187 | 492,570 | 10,383 |
| 25 | Denver-Aurora-Centennial, CO | 184,365 | 194,340 | 9,975 |
| 26 | Huntsville, AL | 111,262 | 120,634 | 9,372 |
| 27 | Allentown-Bethlehem-Easton, PA-NJ | 69,687 | 78,949 | 9,262 |
| 28 | Greensboro-High Point, NC | 219,704 | 228,356 | 8,652 |
| 29 | Cincinnati, OH-KY-IN | 288,338 | 296,888 | 8,550 |
| 30 | Kiryas Joel-Poughkeepsie-Newburgh, NY | 90,111 | 98,383 | 8,272 |
| 31 | Oklahoma City, OK | 154,229 | 162,268 | 8,039 |
| 32 | Augusta-Richmond County, GA-SC | 224,774 | 232,703 | 7,929 |
| 33 | Cape Coral-Fort Myers, FL | 69,933 | 77,794 | 7,861 |
| 34 | Deltona-Daytona Beach-Ormond Beach, FL | 77,128 | 84,606 | 7,478 |
| 35 | Worcester, MA | 54,768 | 62,198 | 7,430 |
| 36 | Little Rock-North Little Rock-Conway, AR | 181,707 | 189,127 | 7,420 |
| 37 | Riverside-San Bernardino-Ontario, CA | 388,874 | 395,898 | 7,024 |
| 38 | Hartford-West Hartford-East Hartford, CT | 149,832 | 156,704 | 6,872 |
| 39 | Dover, DE | 50,348 | 57,139 | 6,791 |
| 40 | Philadelphia-Camden-Wilmington, PA-NJ-DE-MD | 1,382,656 | 1,389,395 | 6,739 |
| 41 | Warner Robins, GA | 66,939 | 73,313 | 6,374 |
| 42 | Portland-Vancouver-Hillsboro, OR-WA | 84,050 | 90,353 | 6,303 |
| 43 | Savannah, GA | 137,803 | 143,976 | 6,173 |
| 44 | Bridgeport-Stamford-Danbury, CT | 121,016 | 127,183 | 6,167 |
| 45 | Killeen-Temple, TX | 108,162 | 114,113 | 5,951 |
| 46 | Palm Bay-Melbourne-Titusville, FL | 66,064 | 71,964 | 5,900 |
| 47 | Nashville-Davidson–Murfreesboro–Franklin, TN | 311,773 | 317,595 | 5,822 |
| 48 | Louisville/Jefferson County, KY-IN | 203,120 | 208,868 | 5,748 |
| 49 | Waterbury-Shelton, CT | 62,816 | 68,442 | 5,626 |
| 50 | Winston-Salem, NC | 128,620 | 134,225 | 5,605 |
| 51 | Clarksville, TN-KY | 65,768 | 71,359 | 5,591 |
| 52 | Richmond, VA | 394,202 | 399,524 | 5,322 |
| 53 | Ocala, FL | 51,202 | 56,275 | 5,073 |
| 54 | Albany-Schenectady-Troy, NY | 83,925 | 88,846 | 4,921 |
| 55 | Baton Rouge, LA | 312,543 | 317,303 | 4,760 |
| 56 | New Haven, CT | 88,457 | 93,143 | 4,686 |
| 57 | Charleston-North Charleston, SC | 202,050 | 206,644 | 4,594 |
| 58 | Greenville-Anderson-Greer, SC | 155,363 | 159,842 | 4,479 |
| 59 | Fayetteville, NC | 151,662 | 155,636 | 3,974 |
| 60 | North Port-Bradenton-Sarasota, FL | 57,915 | 61,787 | 3,872 |
| 61 | Spartanburg, SC | 76,771 | 80,500 | 3,729 |
| 62 | Lafayette, LA | 98,375 | 102,043 | 3,668 |
| 63 | Tuscaloosa, AL | 96,147 | 99,307 | 3,160 |
| 64 | Harrisburg-Carlisle, PA | 67,914 | 70,935 | 3,021 |
| 65 | Tulsa, OK | 86,008 | 88,846 | 2,838 |
| 66 | Greenville, NC | 61,305 | 63,837 | 2,532 |
| 67 | Grand Rapids-Wyoming-Kentwood, MI | 83,417 | 85,732 | 2,315 |
| 68 | Virginia Beach-Chesapeake-Norfolk, VA-NC | 560,715 | 563,023 | 2,308 |
| 69 | Dayton-Kettering-Beavercreek, OH | 131,033 | 133,255 | 2,222 |
| 70 | Montgomery, AL | 174,791 | 176,969 | 2,178 |
| 71 | Omaha, NE-IA | 78,201 | 80,304 | 2,103 |
| 72 | Lexington-Fayette, KY | 60,647 | 62,661 | 2,014 |
| 73 | Springfield, MA | 51,752 | 53,661 | 1,909 |
| 74 | Colorado Springs, CO | 50,268 | 52,161 | 1,893 |
| 75 | Sacramento-Roseville-Folsom, CA | 188,482 | 190,266 | 1,784 |
| 76 | Syracuse, NY | 60,215 | 61,985 | 1,770 |
| 77 | Kansas City, MO-KS | 279,709 | 281,456 | 1,747 |
| 78 | Fresno, CA | 65,889 | 67,628 | 1,739 |
| 79 | Tallahassee, FL | 127,482 | 129,132 | 1,650 |
| 80 | Gainesville, FL | 61,487 | 63,005 | 1,518 |
| 81 | Birmingham, AL | 345,639 | 347,156 | 1,517 |
| 82 | Macon-Bibb County, GA | 108,274 | 109,777 | 1,503 |
| 83 | Valdosta, GA | 52,927 | 54,389 | 1,462 |
| 84 | Knoxville, TN | 54,025 | 55,470 | 1,445 |
| 85 | Akron, OH | 90,111 | 91,526 | 1,415 |
| 86 | Memphis, TN-MS-AR | 643,090 | 644,265 | 1,175 |
| 87 | Gulfport-Biloxi, MS | 92,971 | 94,108 | 1,137 |
| 88 | Washington-Arlington-Alexandria, DC-VA-MD-WV | 1,682,575 | 1,683,593 | 1,018 |
| 89 | Auburn-Opelika, AL | 55,343 | 56,286 | 943 |
| 90 | Rocky Mount, NC | 67,811 | 68,708 | 897 |
| 91 | Wilmington, NC | 51,891 | 52,737 | 846 |
| 92 | Stockton-Lodi, CA | 65,191 | 65,982 | 791 |
| 93 | Florence, SC | 85,717 | 86,432 | 715 |
| 94 | Longview, TX | 53,116 | 53,793 | 677 |
| 95 | Durham-Chapel Hill, NC | 153,966 | 154,226 | 260 |
| 96 | Wichita, KS | 51,653 | 51,872 | 219 |
| 97 | Pensacola-Ferry Pass-Brent, FL | 87,074 | 87,249 | 175 |
| 98 | Atlantic City-Hammonton, NJ | 51,892 | 52,035 | 143 |
| 99 | Jackson, TN | 50,543 | 50,610 | 67 |
| 100 | Mobile, AL | 151,110 | 151,128 | 18 |
| 101 | Toledo, OH | 92,675 | 92,674 | -1 |
| 102 | Chattanooga, TN-GA | 76,619 | 76,566 | -53 |
| 103 | Beaumont-Port Arthur, TX | 98,305 | 98,244 | -61 |
| 104 | Trenton-Princeton, NJ | 82,964 | 82,849 | -115 |
| 105 | San Jose-Sunnyvale-Santa Clara, CA | 56,292 | 56,165 | -127 |
| 106 | Rochester, NY | 133,509 | 133,370 | -139 |
| 107 | Bakersfield-Delano, CA | 56,789 | 56,467 | -322 |
| 108 | Columbus, GA-AL | 143,162 | 142,784 | -378 |
| 109 | Sumter, SC | 50,548 | 50,028 | -520 |
| 110 | Youngstown-Warren, OH | 53,980 | 53,255 | -725 |
| 111 | Pittsburgh, PA | 207,502 | 206,745 | -757 |
| 112 | Buffalo-Cheektowaga, NY | 148,604 | 147,459 | -1,145 |
| 113 | Flint, MI | 82,602 | 81,242 | -1,360 |
| 114 | Albany, GA | 80,731 | 79,234 | -1,497 |
| 115 | Monroe, LA | 85,345 | 83,510 | -1,835 |
| 116 | San Diego-Chula Vista-Carlsbad, CA | 183,167 | 181,332 | -1,835 |
| 117 | St. Petersburg-Clearwater-Largo, FL | 106,806 | 104,909 | -1,897 |
| 118 | Vallejo, CA | 66,189 | 63,991 | -2,198 |
| 119 | Shreveport-Bossier City, LA | 158,925 | 155,585 | -3,340 |
| 120 | San Francisco-San Mateo-Redwood City, CA | 70,170 | 65,590 | -4,580 |
| 121 | Lake Charles, LA | 61,592 | 56,072 | -5,520 |
| 122 | Milwaukee-Waukesha, WI | 266,681 | 260,482 | -6,199 |
| 123 | Jackson, MS | 305,923 | 299,434 | -6,489 |
| 124 | Cleveland, OH | 434,665 | 426,464 | -8,201 |
| 125 | St. Louis, MO-IL | 520,372 | 509,886 | -10,486 |
| 126 | Miami-Fort Lauderdale-West Palm Beach, FL | 1,372,111 | 1,361,439 | -10,672 |
| 127 | Oakland-Fremont-Berkeley, CA | 293,884 | 279,018 | -14,866 |
| 128 | Detroit-Warren-Dearborn, MI | 990,537 | 974,444 | -16,093 |
| 129 | San Francisco-Oakland-Fremont, CA | 371,249 | 351,884 | -19,365 |
| 130 | New Orleans-Metairie, LA | 412,010 | 390,612 | -21,398 |
| 131 | Los Angeles-Long Beach-Anaheim, CA | 978,934 | 943,226 | -35,708 |
| 132 | Chicago-Naperville-Elgin, IL-IN | 1,627,710 | 1,575,970 | -51,740 |
| 133 | New York-Newark-Jersey City, NY-NJ | 3,967,496 | 3,823,081 | -144,415 |
-
Are There Two DCs? Black and White by the Numbers

Are There Two DCs? Black and White by the Numbers Black population by census tract (darker shades indicate higher counts). Source: ACS 5‑year estimates. Key Takeaways Income gap: White per‑capita income is nearly $75,815 higher than Black residents. Employment: Unemployment is 4.1× higher for Black residents; more Black workers in service roles, fewer in professional…
-
Top 5 Cities for Black Population Growth and top 5 Losers.
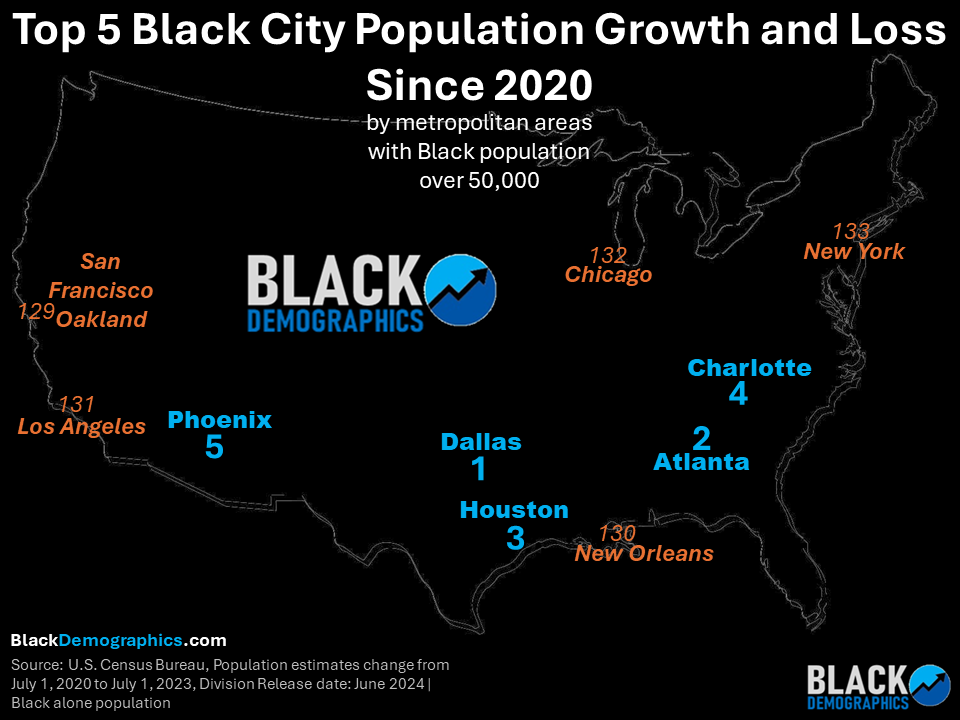
Released in June 2024, the U.S. Census Bureau’s Population Estimates reveal significant shifts in the Black alone population across various metropolitan areas from 2020 to 2023.
-
Data Table: Black Population Growth/Loss in US Metro Areas Since 2020

Ranking the Black population change of 133 Metropolitan Areas with Black population over 50,000. 1 Dallas-Fort Worth-Arlington, TX 2 Atlanta-Sandy Springs-Roswell, GA 3 Houston-Pasadena-The Woodlands, TX