Black Marriage in America

Over the last few decades marriage has been a declining institution among all Americans and this decline is even more evident in the Black community. According to the Census Bureau 2023 ACS survey (released Sept 2024) only 31% of Black Americans were married compared to 48% of all Americans. Half or 50% of African Americans have never been married compared to 34% of all Americans.
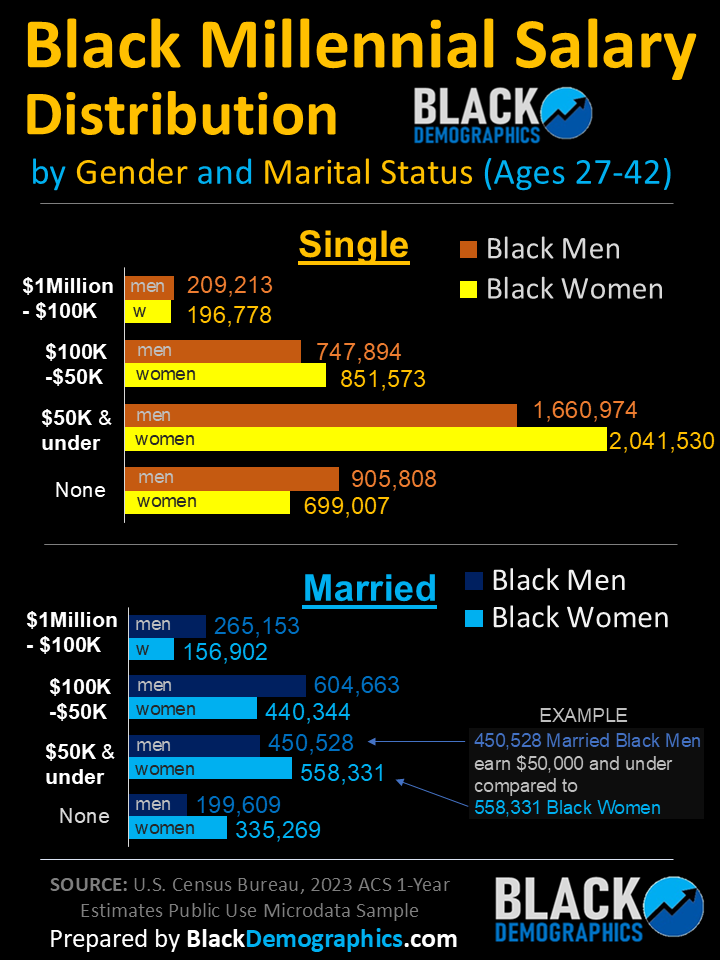
After viewing the available data, we can see that although fewer black women are “now married”, more black women than Black men have been married at least once. This is because a higher percentage of Black women are divorced and widowed than men. Also in 2023 just under half or 49% of black women had never been married which is up from 44% in 2008 and 42.7% in 2005.
Marriage Statistics by Race
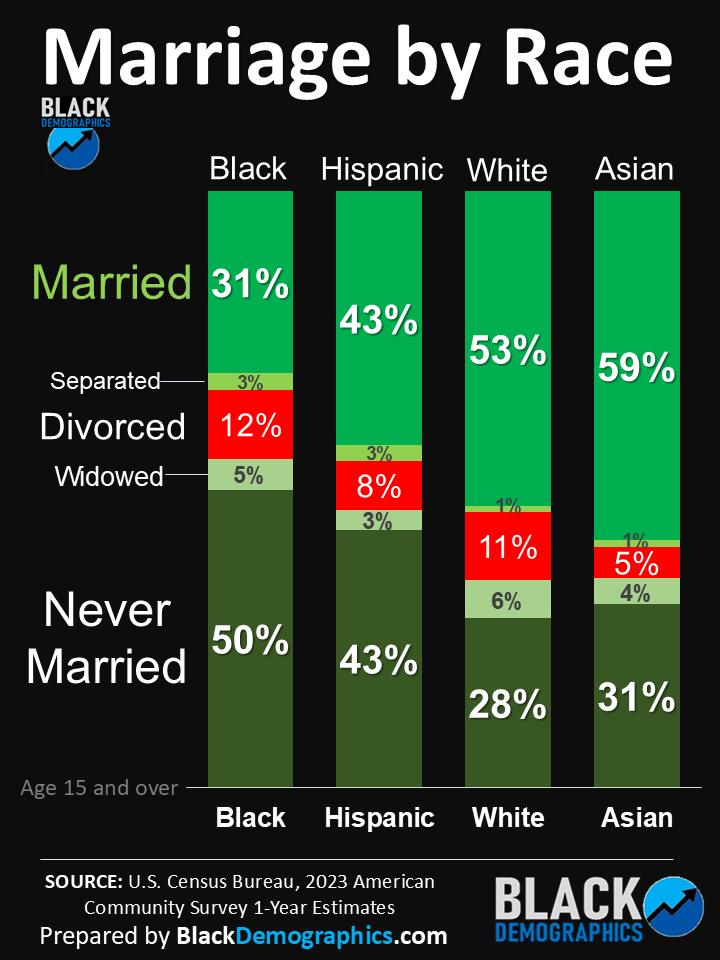
African Americans are the least married of any major racial/ethnic group in America. According to the Census 2023 ACS survey 31% of African Americans were married compared to 43% of Hispanics, 53% of Whites, and 59% of Asians. Also 50% of African Americans have never been married compared to 28% of Whites. Both Black and White Americans have similar divorce statistics which is higher than Hispanic (8%) and Asian (5%). Both Black and Hispanics have the highest percent separated at 3% compared to 1% of Whites and Asians.
Interracial Marriage Statistics
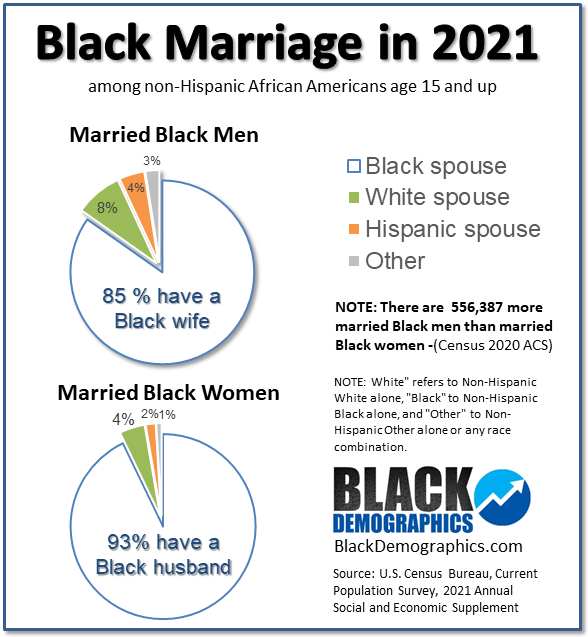
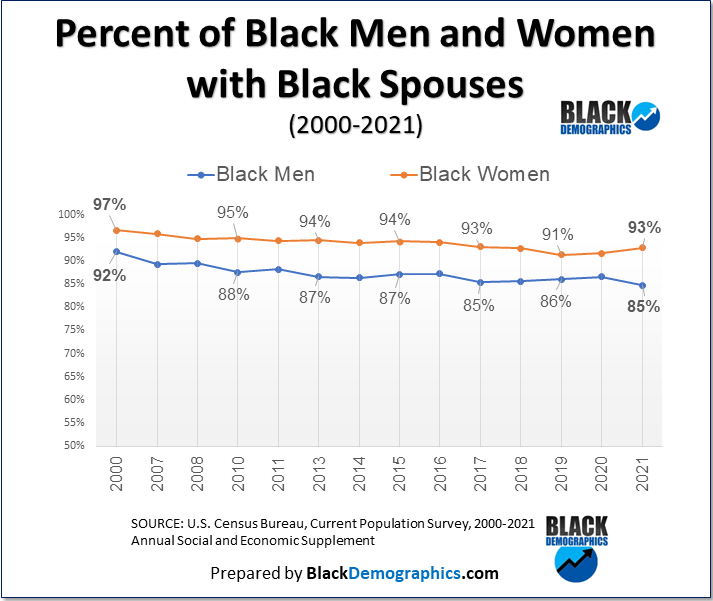
It is also believed that a significant percentage of Black men marry White women. This is often cited as one of the causes of lower marriage rates among Black women. This, however, is only partially true. While Black men marry white women at twice rate that Black women marry White men, in 2021 only 15% percent of married Black men were married to non-Black women which is unchanged from 2017 but up from 11% in 2010 and 8% in 2000. About 8% of married Black men were married to White women in 2021 and 4% were married to Hispanic women.
There was evidence of an increase of Black men “marrying out” of their racial demographic between 2010 and 2017, however that percent has remained steady since. In fact, the Pew Research Center released a report finding that 25% of Black male newlyweds in 2013 married non-Black women compared to 12% of Black women who “married out”. However Asian women and Native Americans still have higher rates of interracial marriage. Black women were the least likely to marry non-Black men at only 7% in 2017, and only 4/% were married to White men.
CLICK TO ENLARGE
CLICK TO ENLARGE
History of Black Marriage
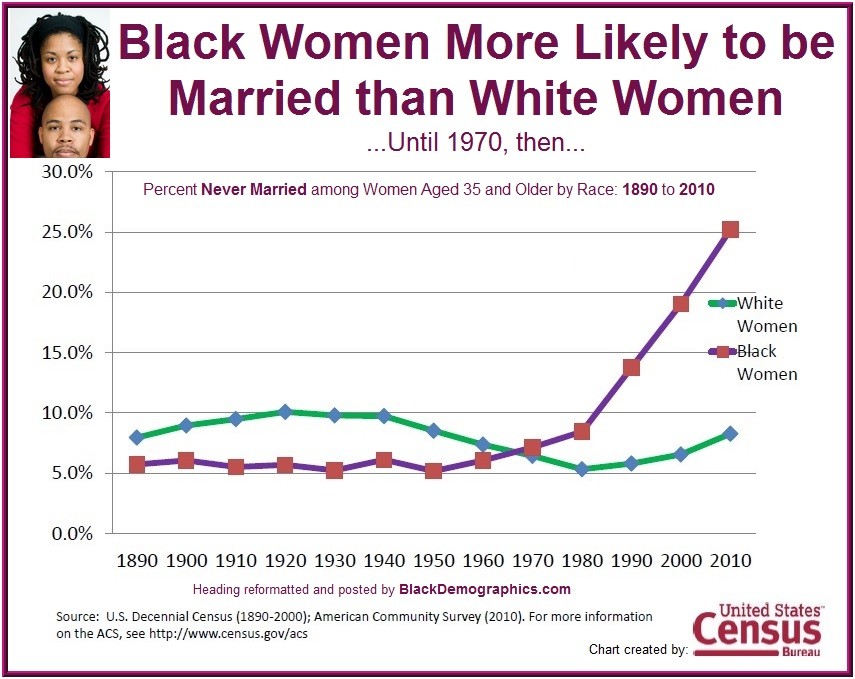
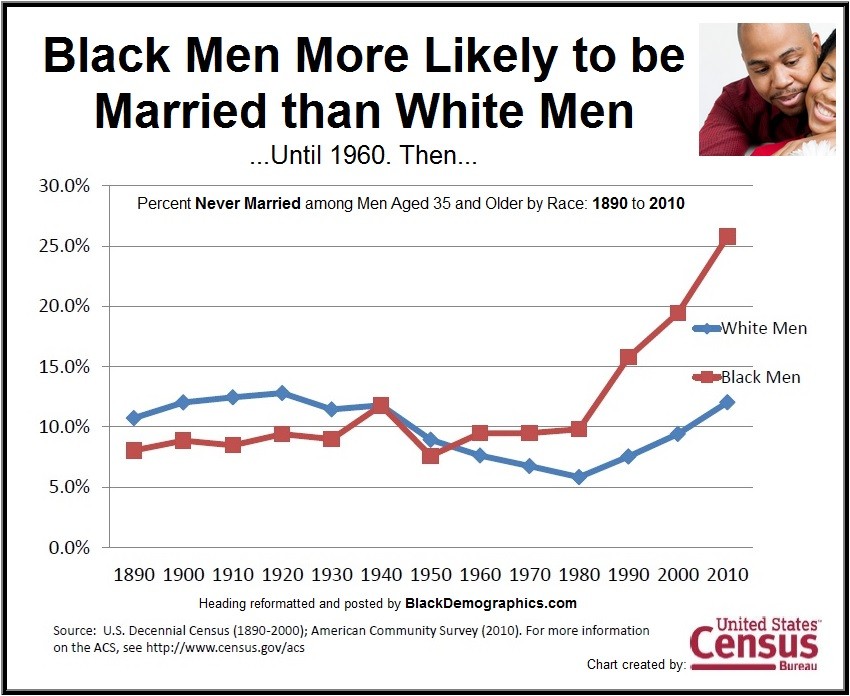
In 2012 The U.S Census Bureau released a report that studied the history of marriage in the United States. They discovered some startling statistics when calculating marriage by race. They found that African Americans age 35 and older were more likely to be married than White Americans from 1890 until sometime around the 1960s. Not only did they swap places during the 60s but in 1980 the number of NEVER married African Americans began a staggering climb from about 10% to more than 25% by 2010 while the percentage for White women remained under 10% and just over 10% for White men. The first two charts below are charts included in the report. Only the headings have been altered by BlackDemographics.com to outline these findings.
CLICK TO ENLARGE
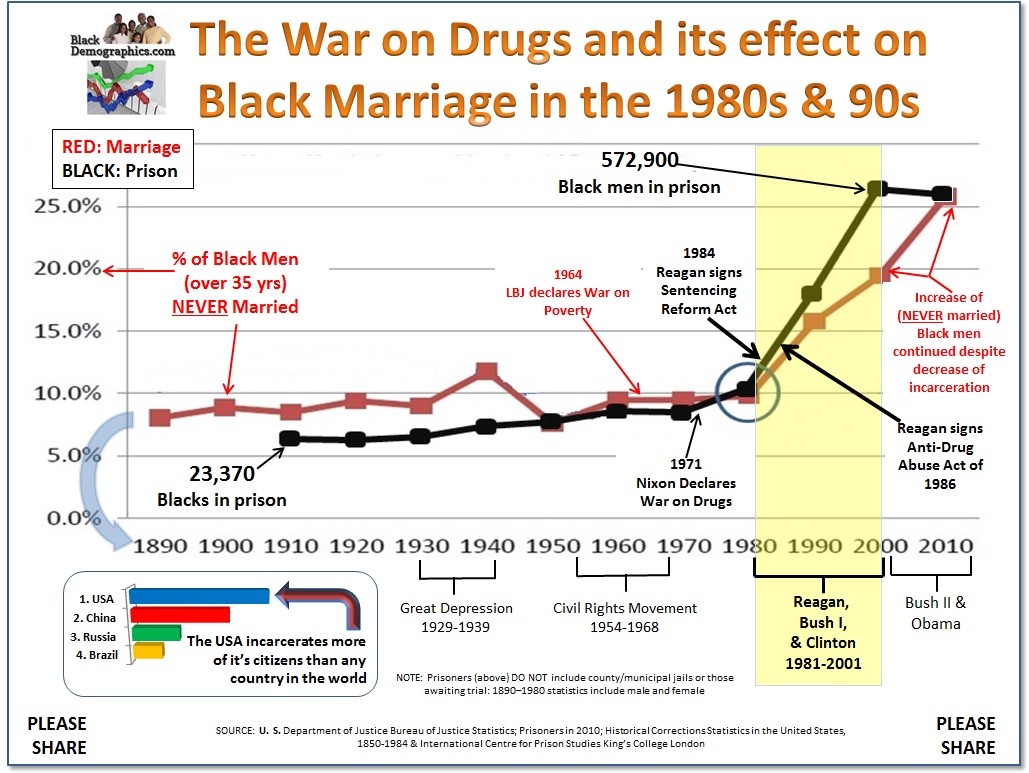
The third chart illustrates how closely the marriage graph for Black men aligns with the incarceration numbers which also experienced an abnormal climb beginning in 1980. This does not prove causation however it shows that they are related due to the assumption that men in prison are less likely to marry.
CLICK TO ENLARGE
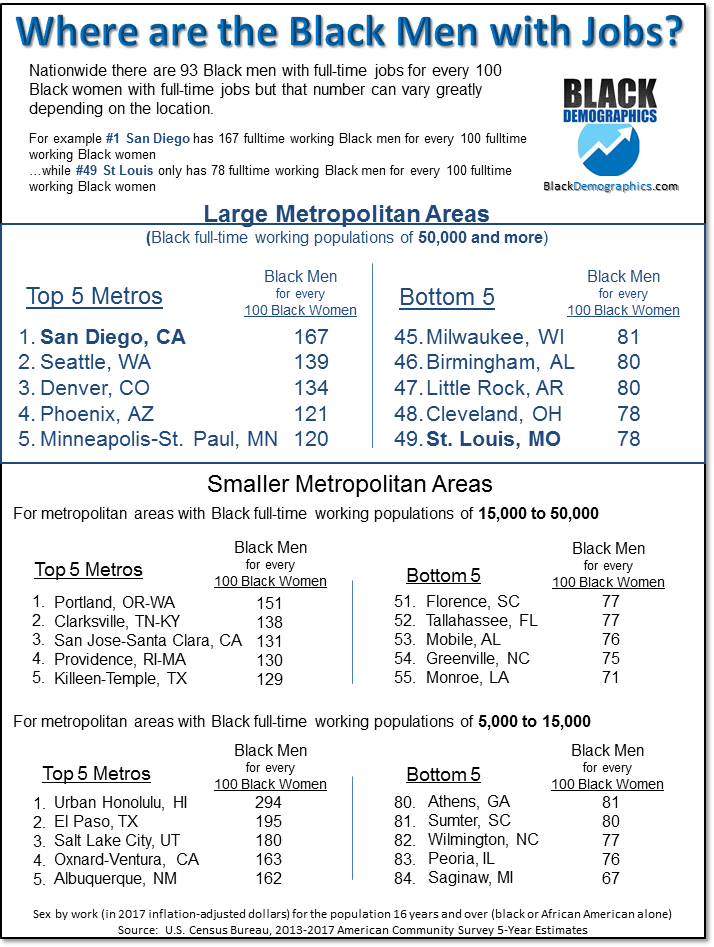
RANK: Cities Where Black Men with Jobs Outnumber Black Women
FULL ARTICLE
MARRIAGE ARTICLES
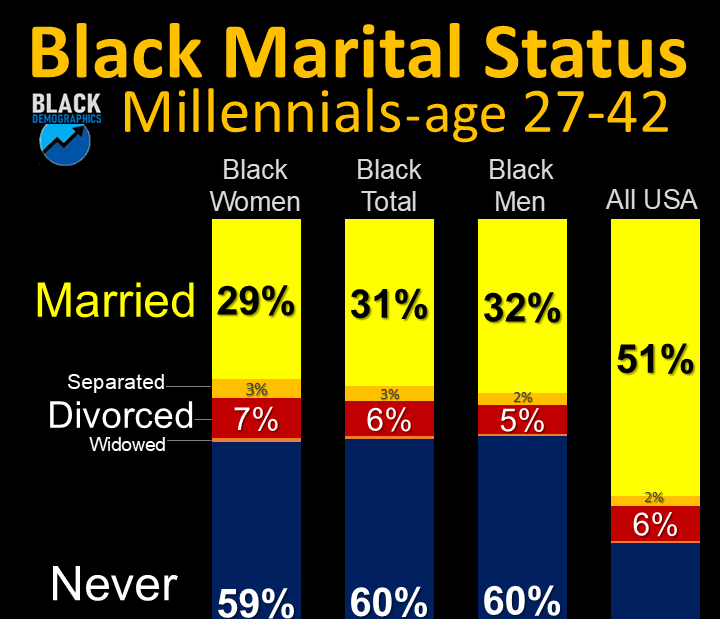
Black Millennials and Marriage
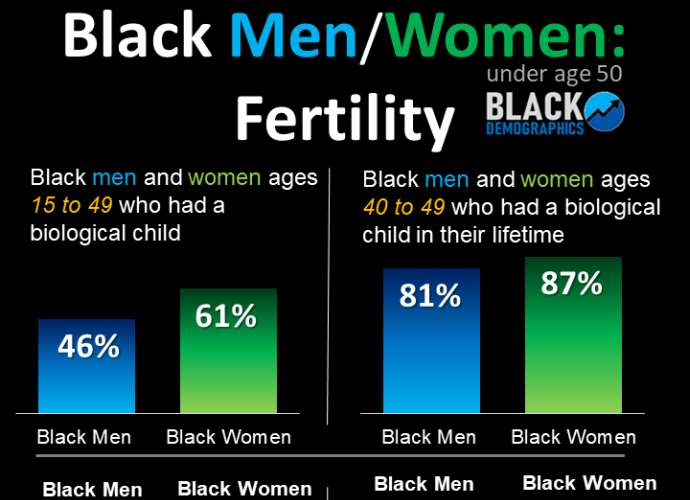
Exploring Black Fertility and Family Trends
DATA CHART: Black Women More Likely to Marry than White Women Until…
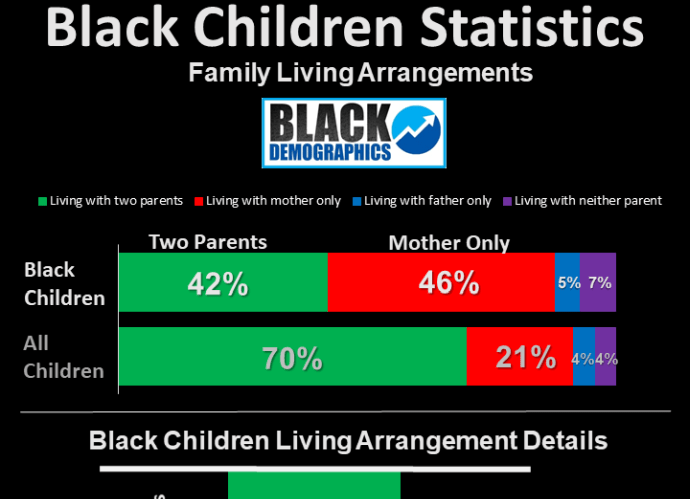
DATA CHART: Black Children, Two-parent Households, and Black Fatherhood
RANK: Cities Where Black Men with Jobs Outnumber Black Women
Single Black GenX Women Outnumber Black Men by 600,000+
In 2021 Overwhelming Majority of Black Men and Women still had Black Spouses


