

The following insights offer an understanding of how Black men and women are distributed across various professions, which in turn can have broader implications for social dynamics, including the realms of dating and marriage.
Occupations with Balanced Representation Among Black Men and Women
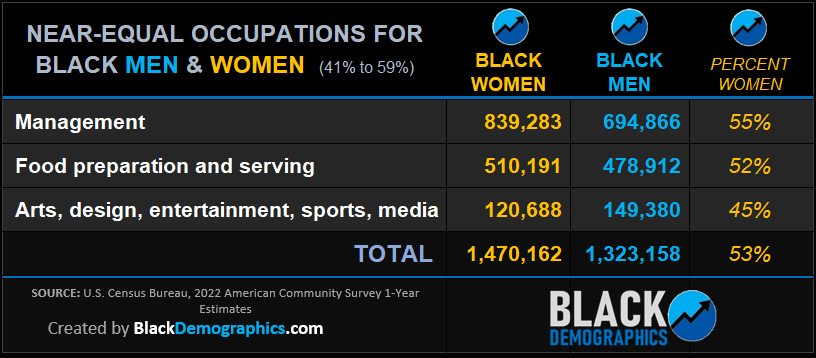
In some fields, the representation of Black men and women is quite balanced:
Management: In the realm of management, there are 839,283 Black women forging ahead, juxtaposed with 694,866 Black men, accounting for women holding 55% of these roles among Black professionals. This contrasts with the White demographic, where White men dominate management positions with a 59% majority, leaving 41% for White women.
Food Preparation and Serving: The balance is more pronounced within the food service industry. Black women represent a slight majority at 52%, tallying 510,191, in comparison to 478,912 Black men. In the White counterpart, the distribution leans towards women at 59%, with men at 41%.
Arts, Design, Entertainment, Sports, Media: Creativity and performance arts present a closer gender division, with Black women making up 45% of the sector, numbering 120,688, while Black men stand at 149,380. The numbers reach parity within the White population, with an even split of 50% each.
Zooming out to the larger picture, Black women have a total presence of 1,470,162 in these fields, with Black men at 1,323,158. On average, women comprise 53% of the Black workforce in these roles, showcasing a noteworthy trend towards gender balance in these occupations.
Sectors with a High Concentration of Black Men
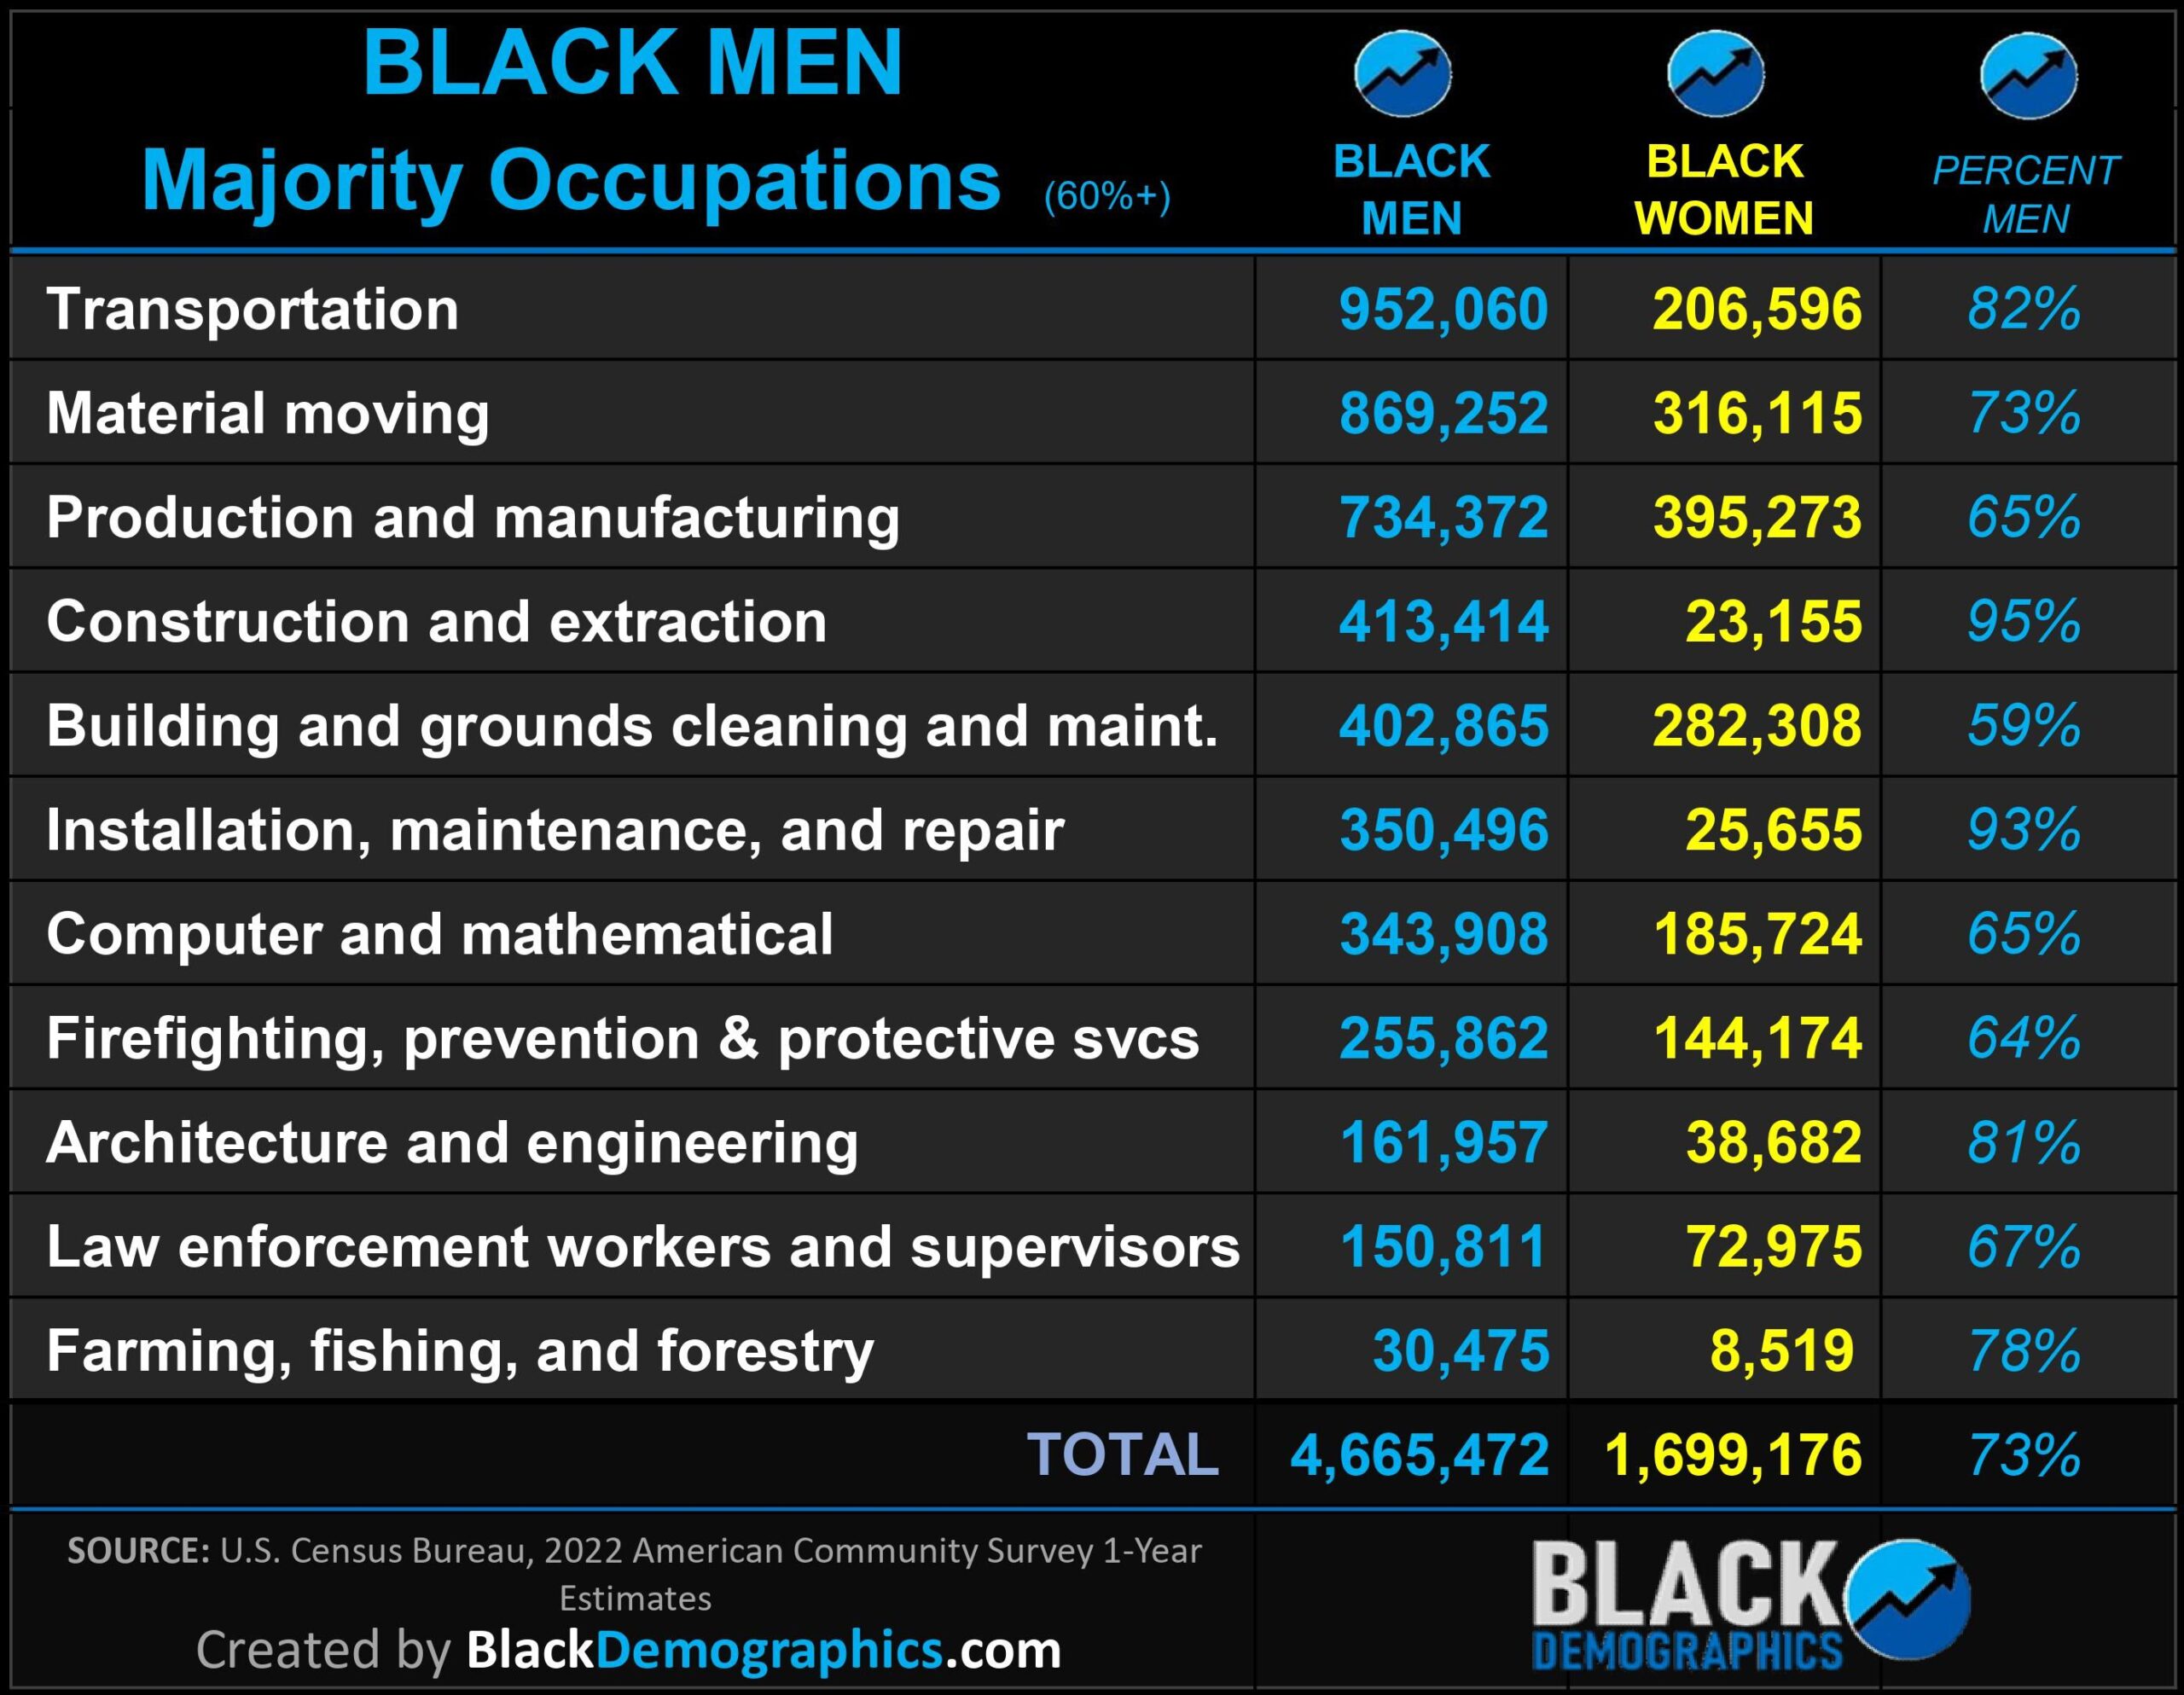
Diving into the statistics, we observe that certain occupations are predominantly filled by Black men, creating a distinct employment pattern:
Transportation: Black men are the driving force in this category, representing an overwhelming 82% of the workforce, which translates to 952,060 individuals. This is a slightly lower figure compared to the White male majority in the same field, which stands at 85%.
Material Moving: This sector also shows a significant skew towards Black male employees, who constitute 73% of its workforce, amounting to 869,252 individuals. White men hold a comparable majority, at 75% in this field.
Production and Manufacturing: In these industrial roles, Black men make up 65%, or 734,372 workers. White men have an even higher representation in these sectors, at 76%.
Industries such as Construction (with Black men at 95%), Maintenance and Repair (93%), and Farming (78%) are heavily male-dominated as well. Collectively, these figures amount to 4,665,472 Black men, overshadowing the 1,699,176 Black women in these fields. Black men average a 73% share across these occupations, underscoring a significant gender disparity in job roles within these sectors.
Fields Where Black Women Predominate
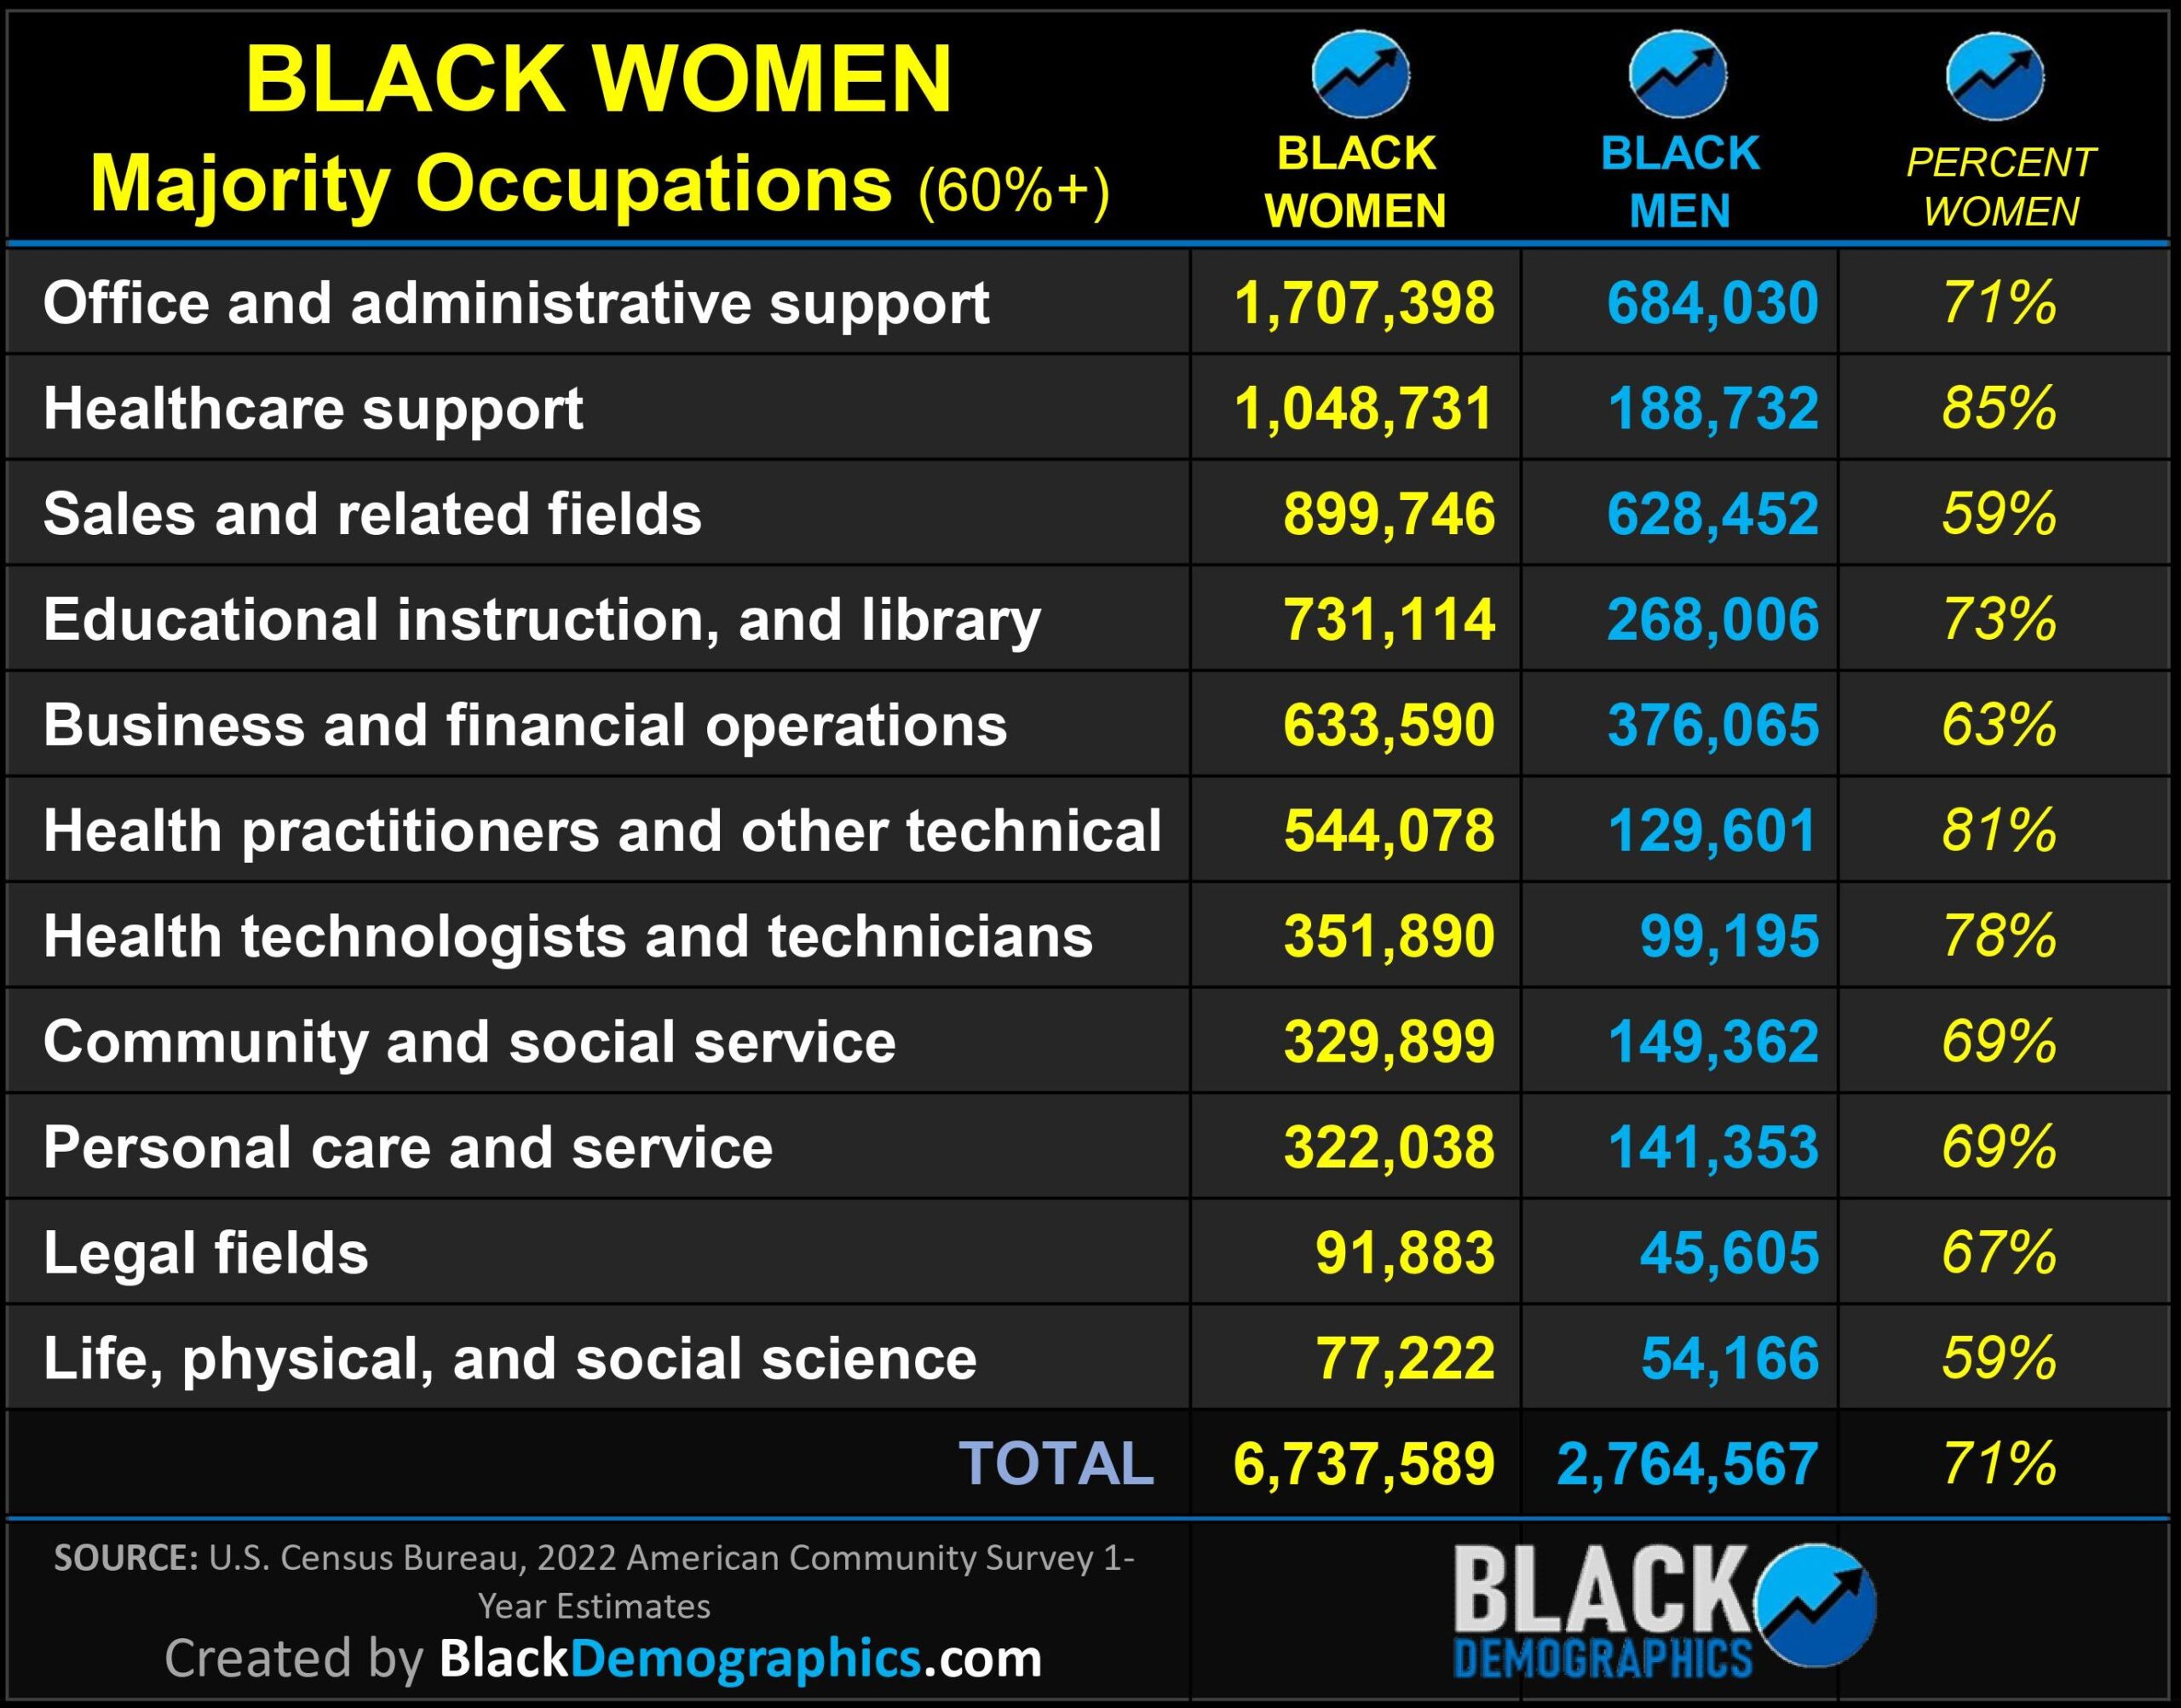
In contrast to some male-dominated fields, there are sectors where Black women significantly lead in representation:
Office and Administrative Support: A commanding 71% of positions in this domain are held by Black women, representing 1,707,398 strong, skilled professionals. This number is quite close to the 75% prevalence of White women in the same sphere.
Healthcare Support: Black women have an even more pronounced presence here, constituting 85% of the Black workforce with 1,048,731 positions. This is nearly on par with White women, who make up 86% of their demographic in this field.
Educational Instruction and Library: In this educational realm, 73% of roles are filled by Black women, amounting to a robust 731,114 individuals. This percentage matches that of White women, who also make up 73% in these occupations.
Altogether, Black women occupy 6,737,589 roles across these professions, while Black men hold 2,764,567, signifying that on average, Black women account for 71% of the workforce in these particular fields. This demonstrates a strong female presence and highlights the substantial contribution of Black women to these vital sectors.
### Contextualizing the Data
These percentages provided do not represent the proportion of all individuals in each occupation but rather the percentage of those within the Black community who have chosen to identify solely as Black.
These figures are crucial for understanding the choices and trends within the Black community and are not indicative of the racial makeup of the entire occupational workforce. The disparities in occupational choices between Black men and women may also reflect and potentially impact their social standings and interactions in broader society.
(Source: U.S. Census Bureau, 2022 American Community Survey 1-Year Estimates, created by BlackDemographics.com)
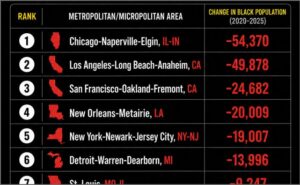
- Which Metropolitan Areas Lost the Most Black Residents Between 2020 and 2025?
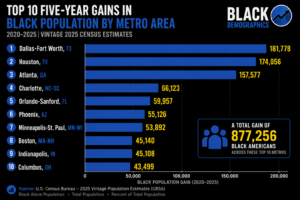
- Texas Leads the Nation as Black Population Growth Reshapes America’s Largest Metropolitan Areas
- Black Unemployment Hits Another 2025 High in November

- 2025 Jobless Divide: The Gap for Black Women Is Widening

- Are There Two DCs? Black and White by the Numbers
