

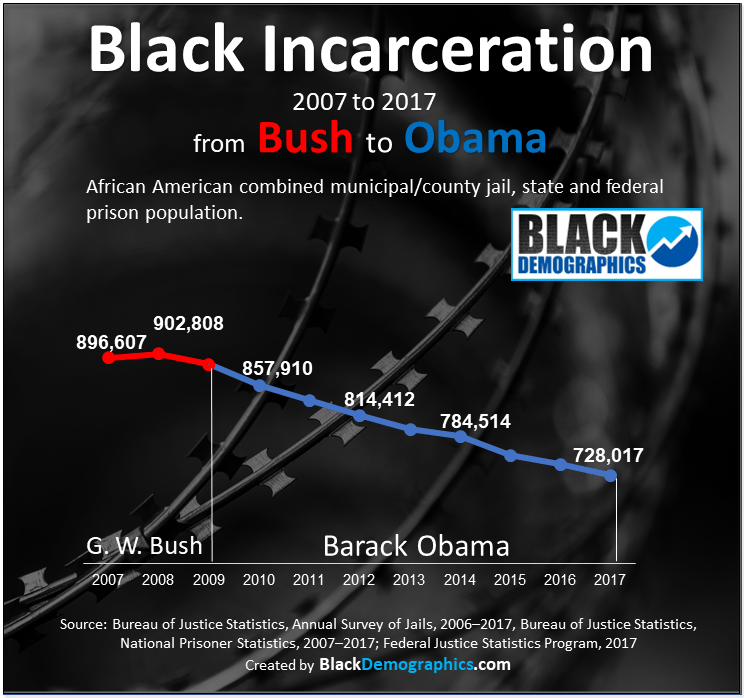
The chart above shows the decline of the overall incarceration of African Americans in the United States from its all time peak in 2008. As the chart shows the decrease began during the last year of the Bush administration and continued during the entire 8 years of the Obama administrations ending the beginning of 2017. Data during the Trump administration was not available at the time of this chart. Totals incarcerated on this chart includes state and federal prison populations as well as those being held in local county and municipal jails.
In 2017 there were 728,017 incarcerated African Americans, 475,900 in State and federal prisons and 250,100 in local, county and municipality jails
NOTE: Those being held in local, county and municipal jails are not all convicted of crimes. Many are awaiting trial or to be bonded out after being arrested.
Source: Bureau of Justice Statistics, Annual Survey of Jails, 2006–2017, Bureau of Justice Statistics, National Prisoner Statistics, 2007–2017; Federal Justice Statistics Program, 2017. Created by BlackDemographics.com