African American Employment
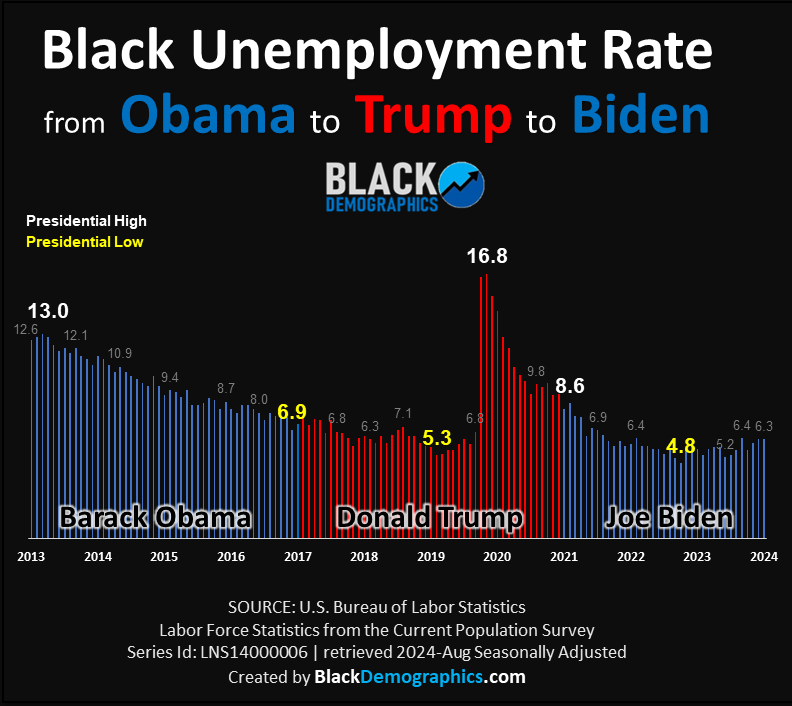
Although African Americans have an unemployment rate almost double that of the overall population, the Black workforce is just as diverse.
The comparison of African American employment data from 2017 to 2022 shows notable improvements and ongoing disparities. For Black men aged 25 to 64, the employment rate increased from 66% to 69%, while the percent unemployed decreased from 6% to 5%.
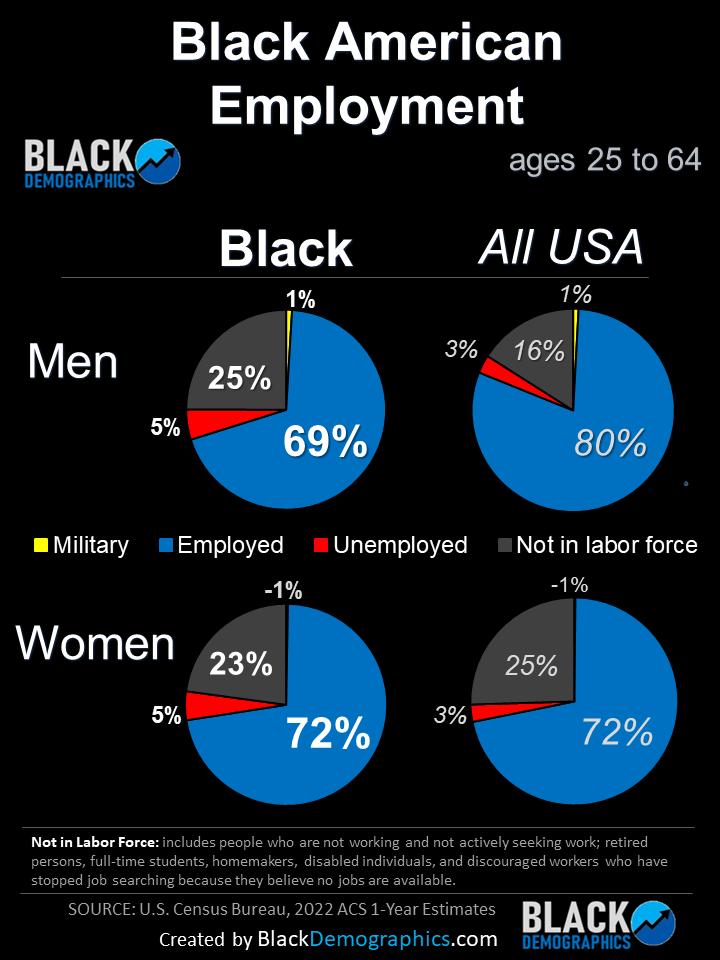
Despite these gains, Black men still have a higher percentage not in the labor force (25%) compared to all men (16%). Black women saw their employment rate rise from 70% to 72%, matching the overall rate for all women. Their percent unemployed remained stable at 5%, consistent with the general population.
Key Findings:
- Employment Rates:
- Black men: 66% (2017) to 69% (2022)
- Black women: 70% (2017) to 72% (2022)
- Percent Unemployed:
- Black men: 6% (2017) to 5% (2022)
- Black women: Stable at 5%
- Not in Labor Force:
- Black men: 27% (2017) to 25% (2022)
- Black women: 25% (2017) to 23% (2022)
Significance: The increase in employment rates for both Black men and women, along with the decrease in percent unemployed for Black men, indicates positive trends in job market participation. However, the higher rate of Black men not in the labor force compared to all men underscores the need for continued efforts to enhance labor market inclusion.
Conclusion: These data highlight progress in employment for African Americans, particularly for Black women whose employment rate now equals that of all women. Yet, the persistent higher non-participation rate for Black men indicates areas requiring targeted interventions to promote workforce opportunities.
In 2017 about 73% of Black men ages 25 to 64 were in the labor force including 66% who were employed, 6% who were unemployed, and 1% in the armed forces. This compares to the 83% of all men nationwide who are in the labor force. People who are not in the labor force are not looking for work for various reasons including full-time school, disabled, homemaker, incarceration, etc.
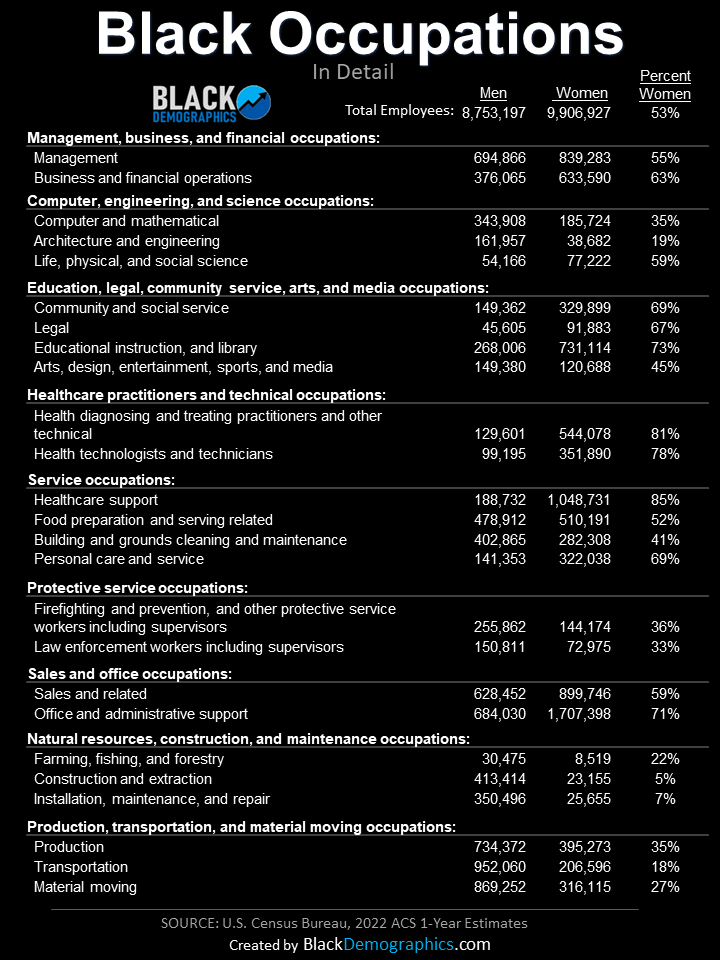
Occupations of African Americans
Overall Employment Trends: In examining the most recent occupation numbers from the Census Bureau 2022 to with the data from 2017, African Americans have shown a notable presence in various occupational sectors, although disparities compared to the overall population persist. The representation of African Americans in management, business, science, and arts occupations increased slightly from 30% in 2017 to 32% in 2022. This trend is particularly pronounced among Black women, who saw an increase from 35% to 38% during the same period (both up from 32% in 2011), indicating growing opportunities in high-skill, white-collar jobs. However, Black men remain underrepresented in these roles compared to all men (26% vs. 38% in 2022).
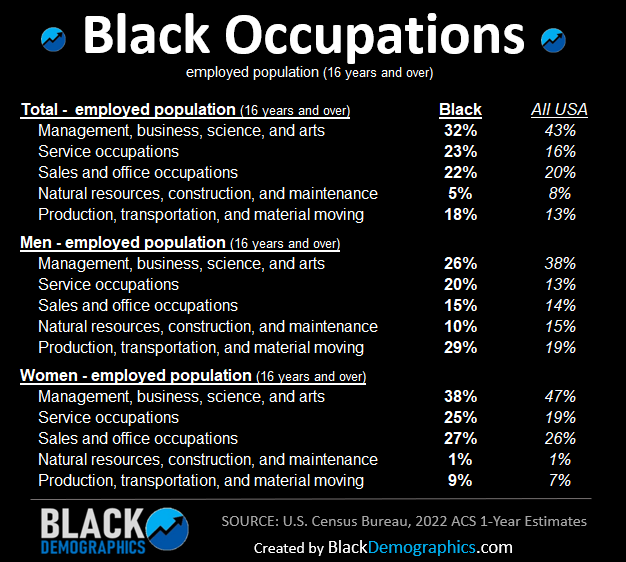
Service Occupations: Service occupations have seen a slight decrease for African Americans, with Black men decreasing from 22% in 2017 to 20% in 2022 and Black women from 27% to 25%. Despite this decrease, African Americans still have a higher representation in these roles compared to the overall population, where the figures are 13% for men and 19% for women in 2022.
Sales and Office Occupations: Sales and office occupations have also experienced a slight decline among African Americans. Black men decreased from 18% in 2017 to 15% in 2022, while Black women decreased from 30% to 27%. These roles remain significant for Black women, who are on par with the overall population at 27%.
Natural Resources, Construction, and Maintenance Occupations: There has been little change in the representation of African Americans in natural resources, construction, and maintenance occupations, with Black men maintaining a stable 10% from 2017 to 2022, and Black women remaining at 1%. This sector remains an area with significant underrepresentation compared to the overall population, particularly for women (4% in 2022).
Production, Transportation, and Material Moving Occupations: An increase in representation is noted in production, transportation, and material moving occupations, especially among Black men, who increased from 26% in 2017 to 29% in 2022. Black women also saw a slight increase from 8% to 9%. Compared to the overall population, Black men have a significantly higher representation in these roles (29% vs. 19% in 2022).
Key Comparisons and Observations:
- Black men, while showing some improvements in high-skill occupations, continue to be underrepresented compared to all men, particularly in management and professional roles.
- Black women have made considerable strides in professional roles, approaching the overall representation of women in management and business sectors.
- Both Black men and women remain more represented in service occupations compared to the overall population, though this representation has slightly decreased since 2017.
- There is a notable stable representation in natural resources, construction, and maintenance occupations, with significant underrepresentation compared to the overall population, especially among Black women.
- The increase in production, transportation, and material moving occupations highlights a critical employment sector for Black men.
Conclusion: The data from 2017 to 2022 indicates progress in certain areas for African American employment, particularly for Black women in professional roles. However, disparities remain, especially for Black men in high-skill occupations. Understanding these dynamics is essential for addressing employment disparities and promoting equitable opportunities in the workforce. The ongoing presence in service, production, and transportation sectors underscores the need for targeted support and development to bridge the gaps and enhance occupational diversity for African Americans.
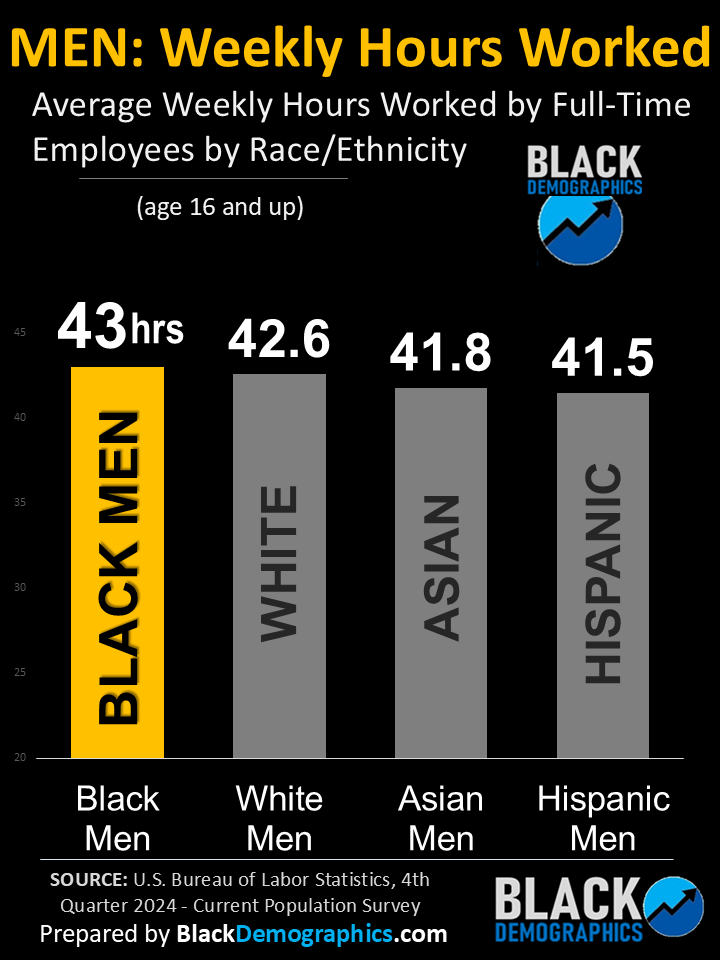
Black men put in the most hours weekly among full-time male workers. Data from BLS.
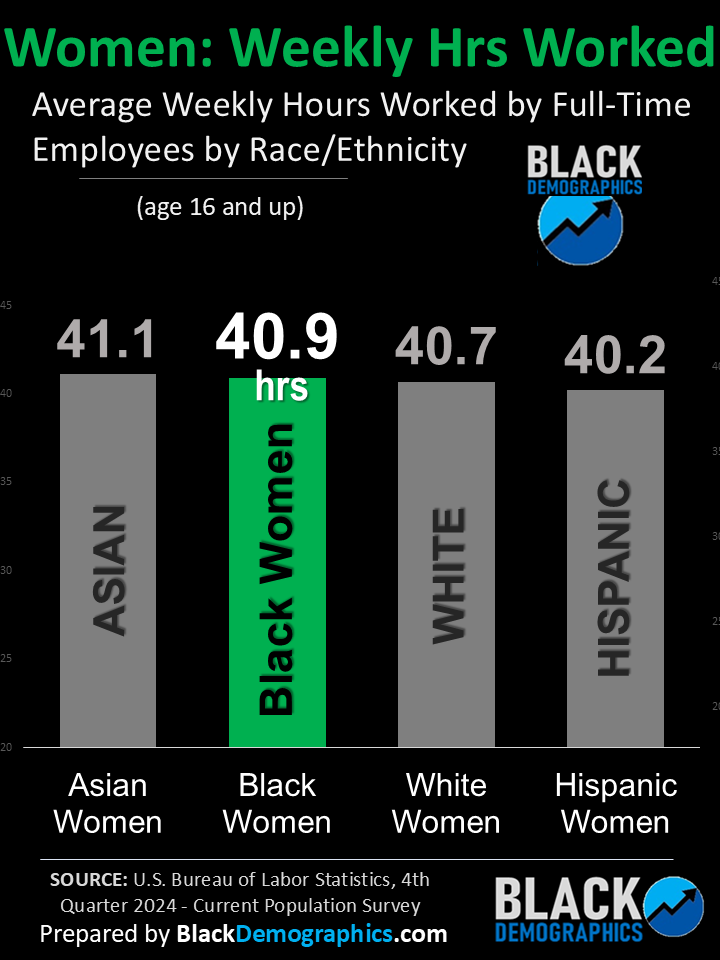
Among full-time workers, Black women’s average weekly hours are slightly higher than White and Hispanic women.
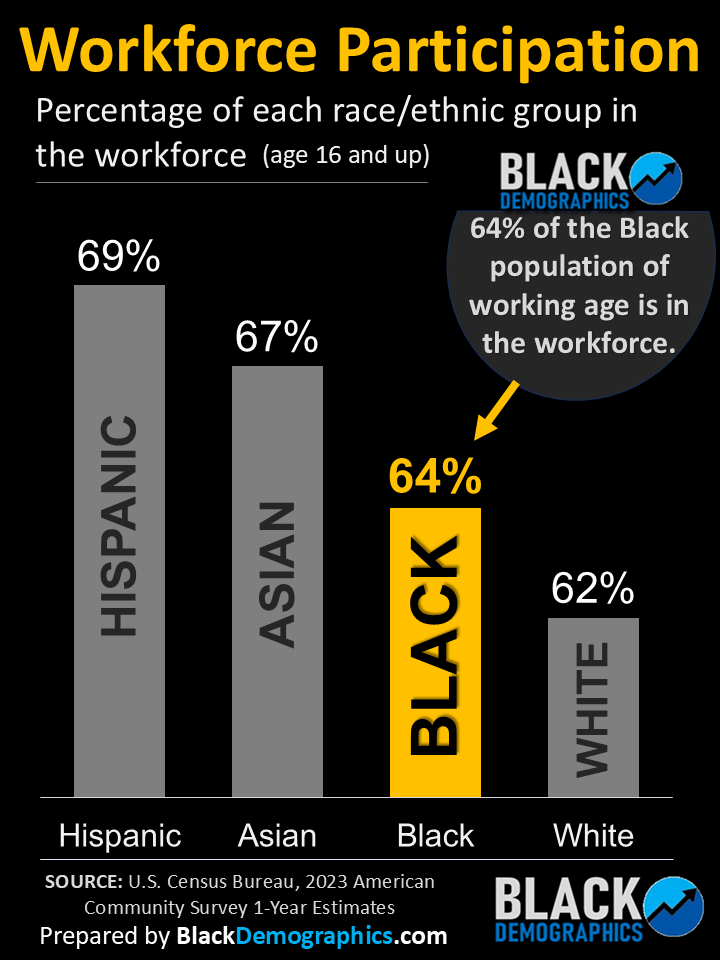
64% of the working-age Black population is in the workforce. This means that a larger percent of working-age African Americans are either employed or actively looking for work than White Americans, but lower than Hispanic and Asian Americans.
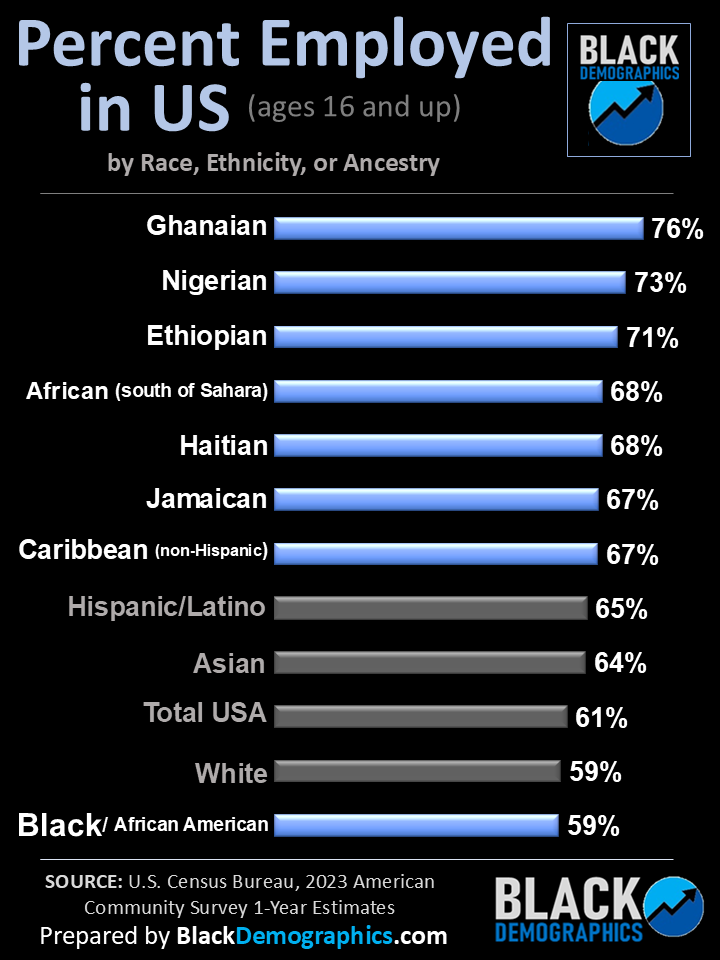
The percent of employed working-age Black/African Americans is statistically the same as White Americans, however both are lower than Americans as a whole.