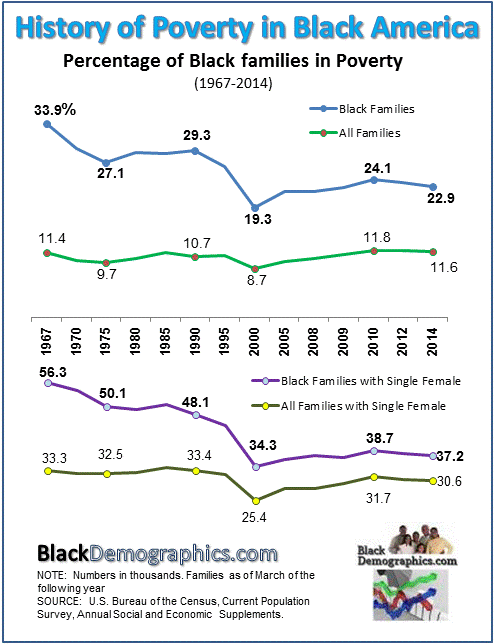
The U.S. Census Bureau records historical poverty data among American families using its Current Population Survey and Annual Social and Economic Supplements (chart below). In 1967 about one third (33.9%) of all Black families lived below the poverty level compared to only 11% of all families in America . By 1990 the disparity gap between the two remained virtually the same despite a slight decrease in the overall poverty rate for both population groups. During the decade of the 1990s while the nation was experiencing an economic boom the poverty rate of Black families dropped from 29% in 1990 to 19% in 2000 virtually cutting the disparity in half. The economic downturn in the decade from 2000 to 2010 caused the increase of the Black family poverty rate to 24%. Since 2010 the Black family poverty rate began to decrease sightly reaching 23% in 2014, however the disparity has remained relatively unchanged since 2000.

In 1967 more than a half (56%) of Black families headed by single women lived below the national poverty level compared to 33% of all families in America headed by single women. During the decade of the 1990s the poverty rate of families headed by Black single mothers dropped from 48% in 1990 to its lowest point (34%) in 2000. The economic downturn in the decade from 2000 to 2010 increased the Black family poverty rate to 39% by 2010. Since 2010 the Black family poverty rate decreased sightly to 37% by 2014. Although the actual disparity between Black single mother families and all single mother families has always been lower than that between all family types the adjustments (increases and decreases) in disparity over the decades have been fairly similar.
See this and more at: https://blackdemographics.com/households/poverty/

