

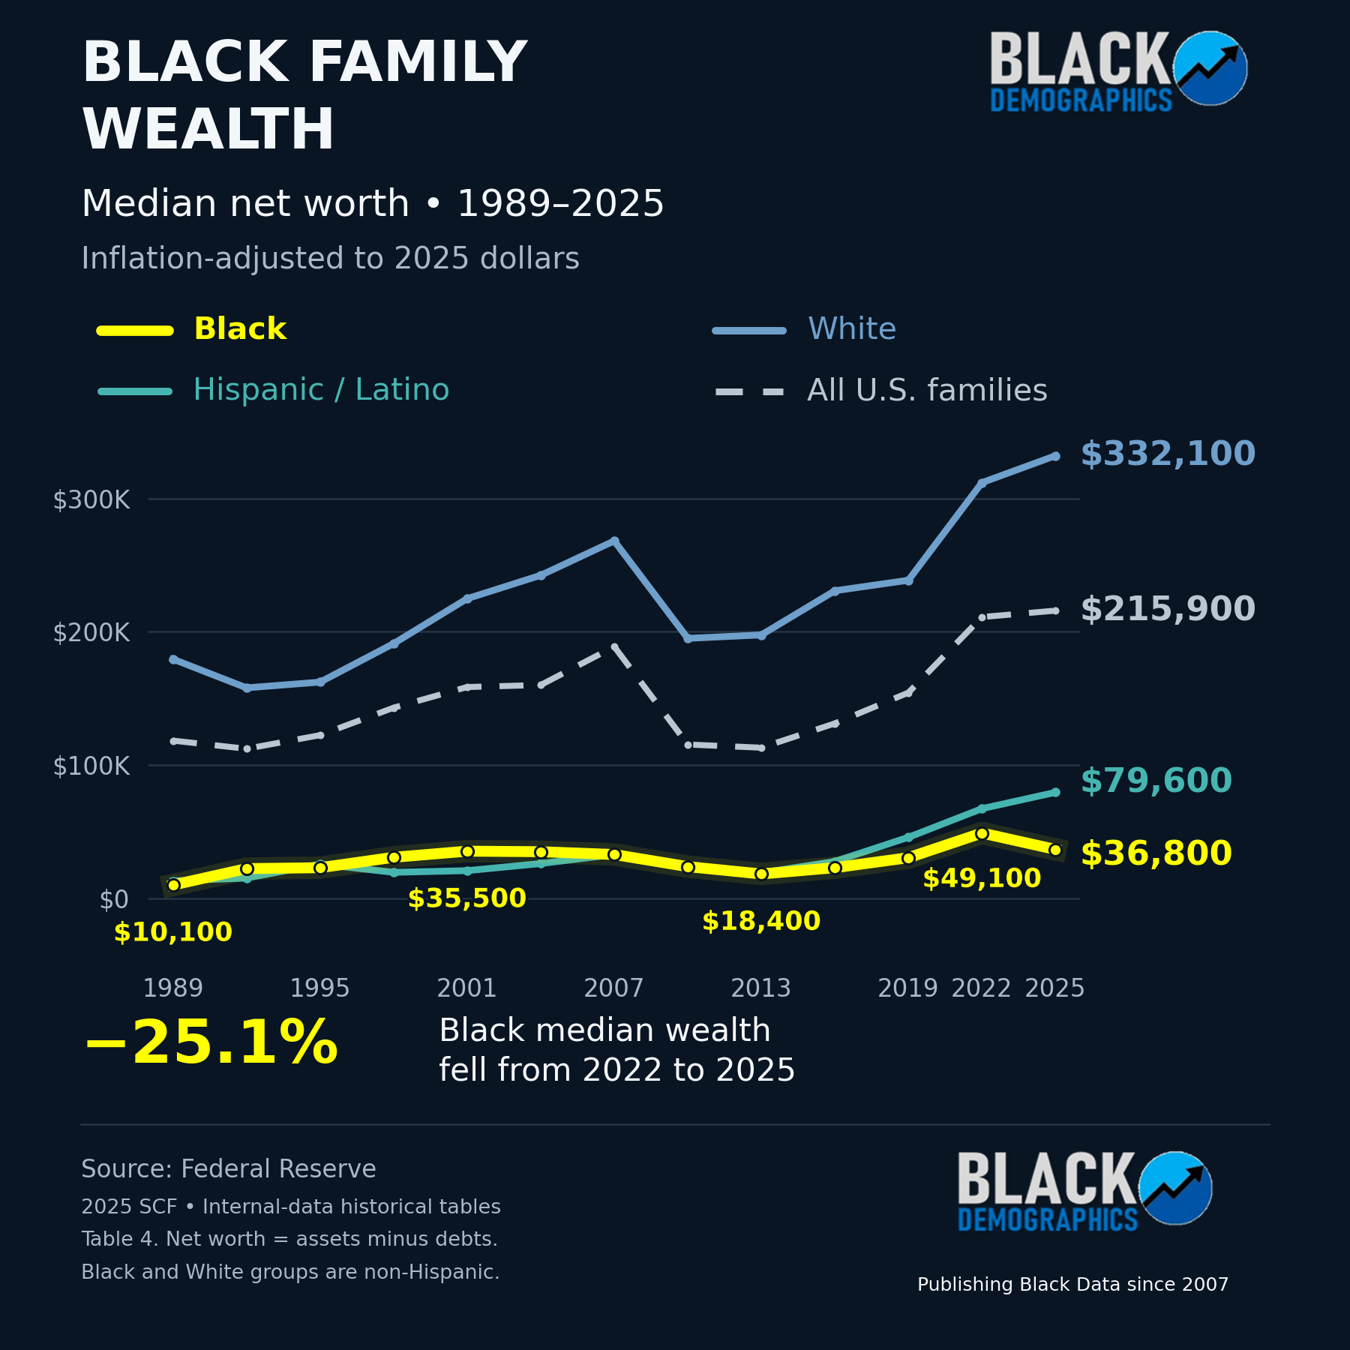
Black median family wealth fell about 25% between 2022 and 2025, after inflation. That decline deserves attention. But the charts show a larger problem: a wide racial wealth gap that has lasted for decades and remains within every age group shown.
The Federal Reserve’s published figures put Black median family net worth at $36,800 in 2025, compared with $332,100 for White families and $79,600 for Hispanic families. The White median was about nine times the Black median. federalreserve.gov
Net worth is the value of what a family owns minus what it owes. It includes home equity, savings, investments, retirement accounts, vehicles, and businesses, after subtracting debts. The median is the middle value: half of families have more, and half have less. An average can be pushed much higher by a small number of very wealthy families.
The latest drop followed strong gains. Black median wealth rose 60.5% from 2019 to 2022, then fell 25.1% through 2025. Even after that loss, it remained about 20% above its 2019 level. The recent decline was the second-largest three-year percentage loss in the historical series shown, following the 27.6% decline from 2007 to 2010. These changes were calculated from the Fed’s historical tables. www.federalreserve.gov
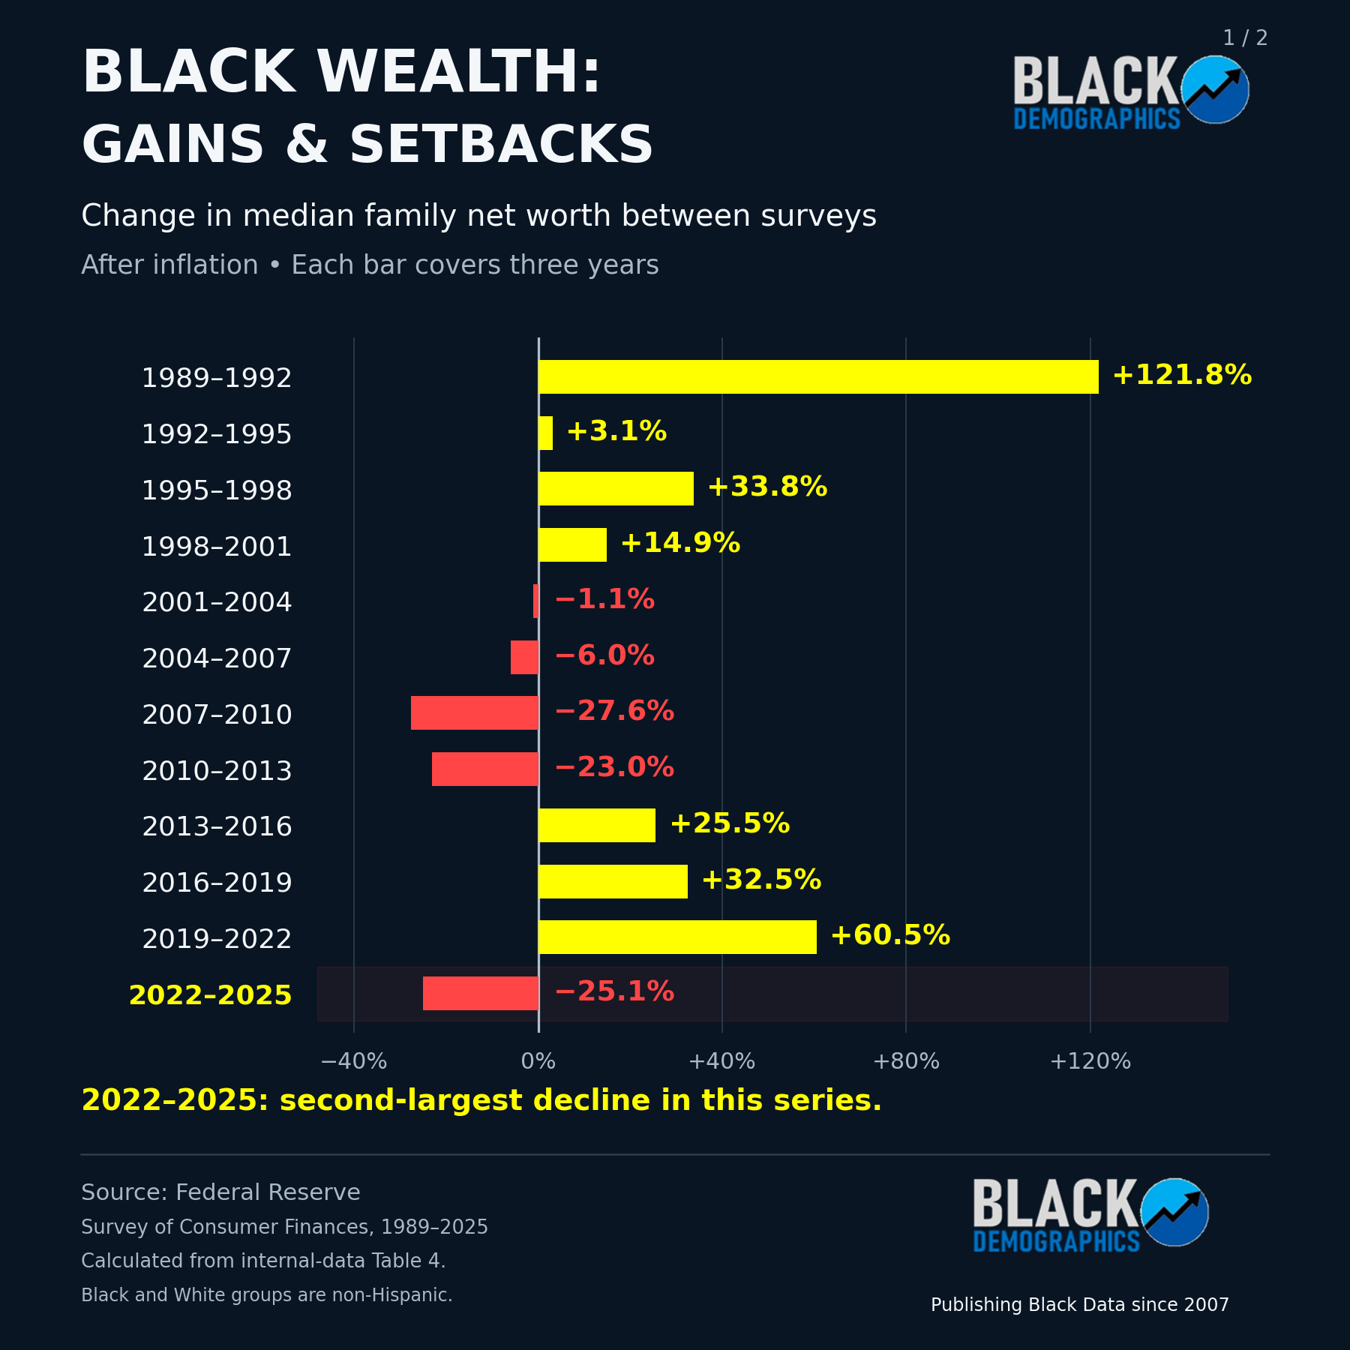
Large percentage gains do not always close a dollar gap. A 50% increase on $20,000 adds $10,000. A 10% increase on $200,000 adds $20,000. The family with less wealth can grow faster in percentage terms and still fall further behind in dollars. Fed researchers documented this pattern during the 2019–2022 recovery. federalreserve.gov
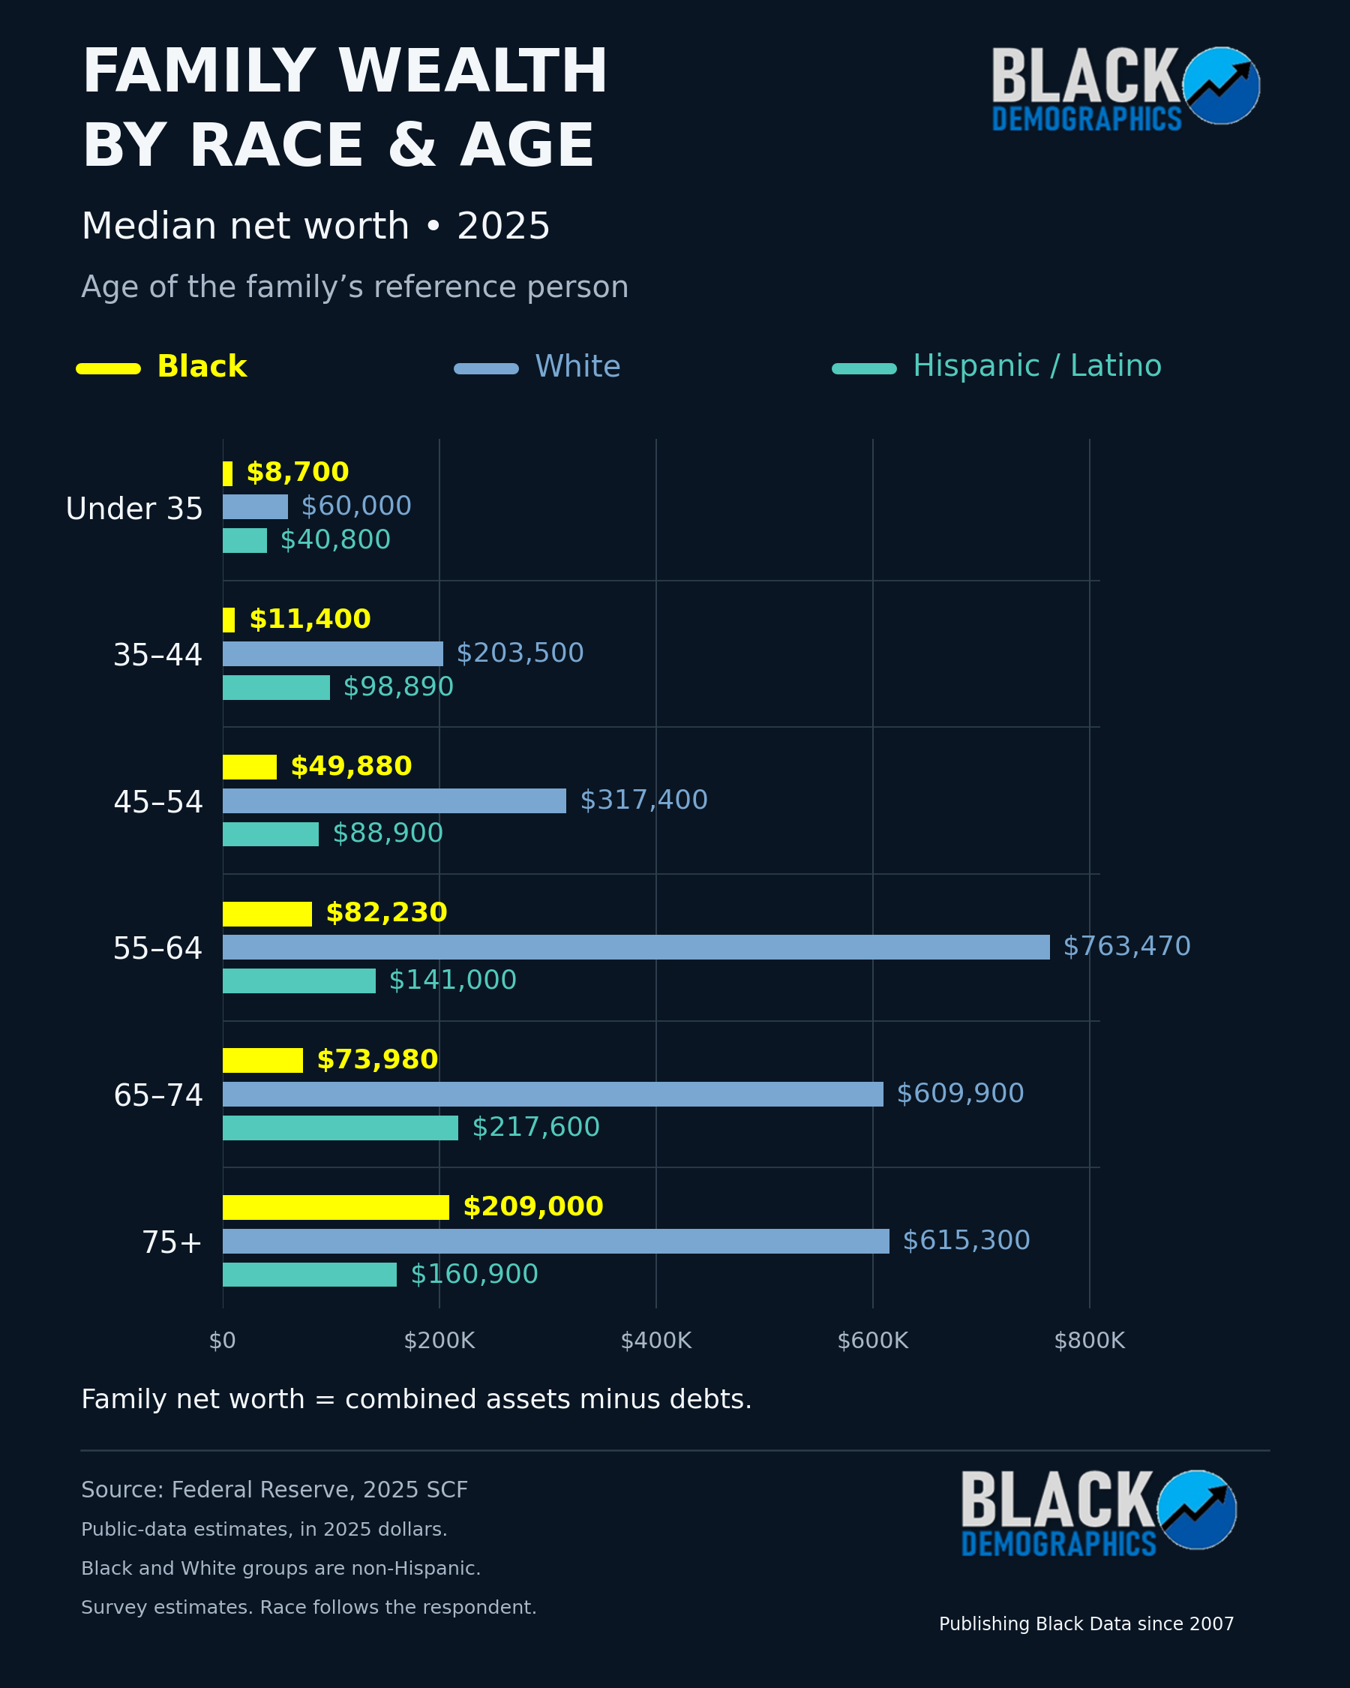
The age chart shows that the gap also remains when comparing families in the same age range. BlackDemographics.com’s calculations using the Fed’s public data found that Black families with a reference person ages 35–44 had median wealth of $11,400. The White median was $203,500, and the Hispanic median was $98,890.
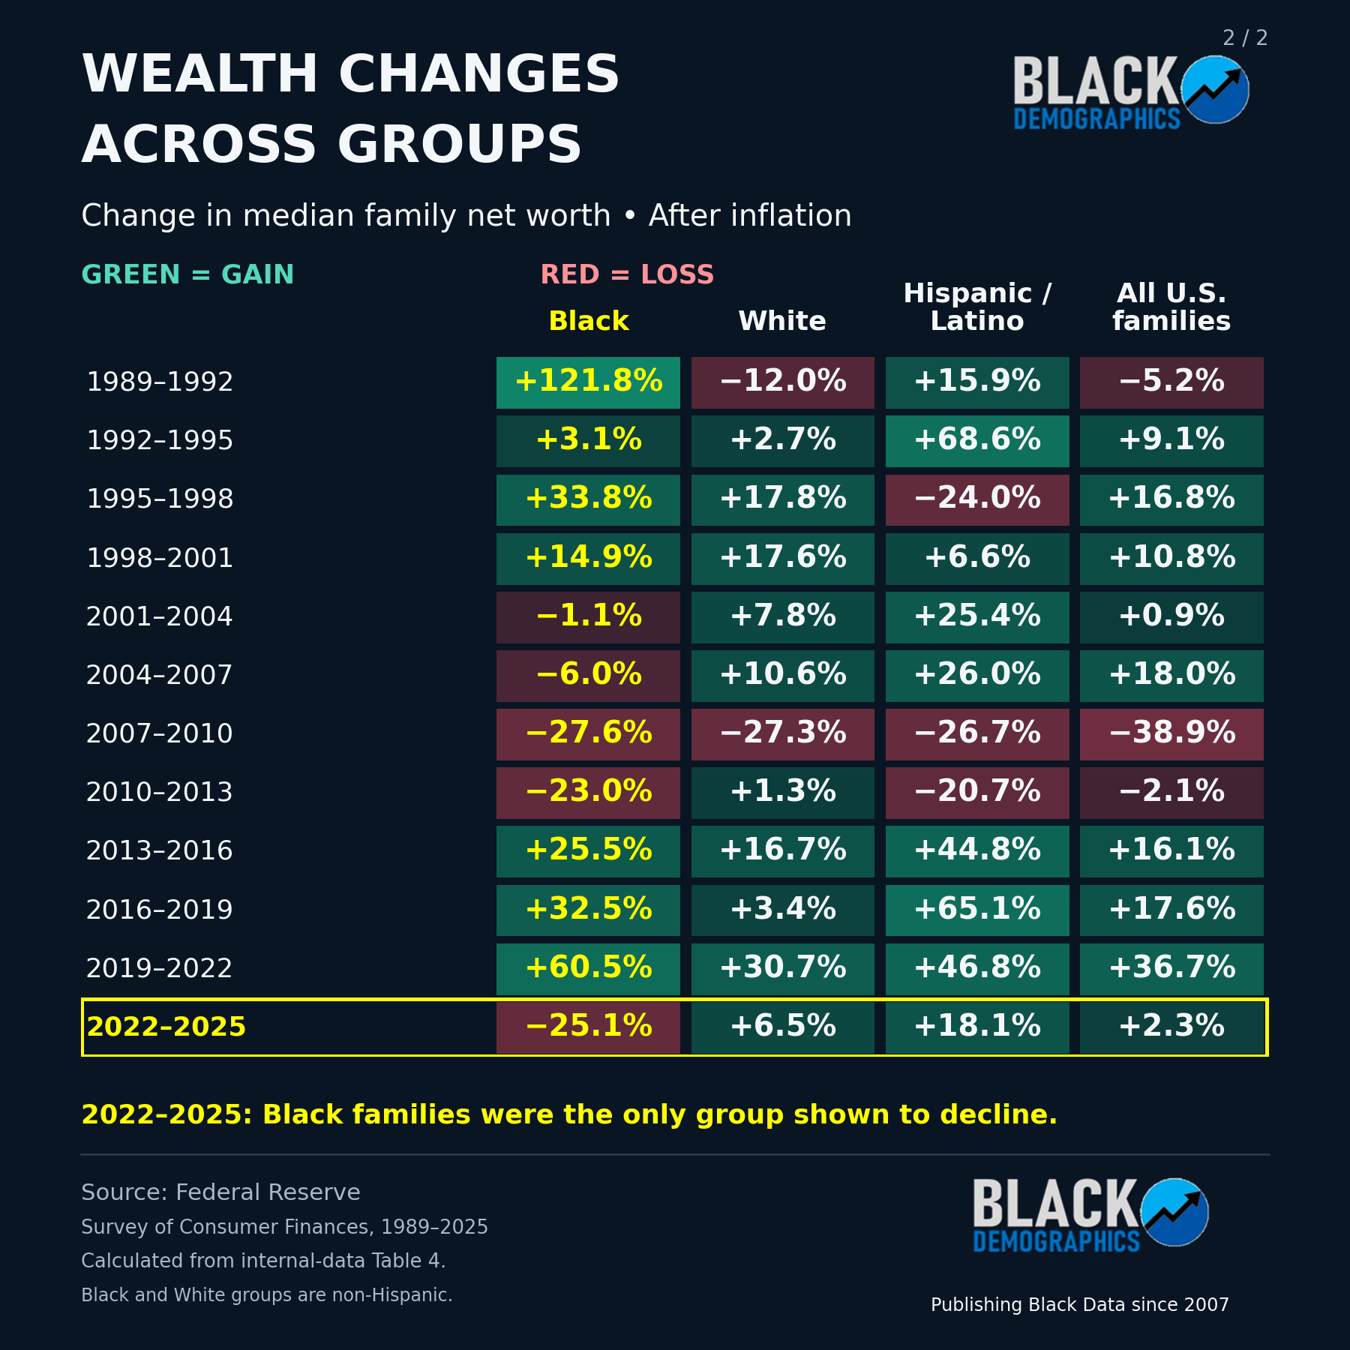
At ages 55–64, the figures were $82,230 for Black families, $763,470 for White families, and $141,000 for Hispanic families. These figures measure the family’s combined wealth, grouped by the reference person’s age. They compare different families in 2025, rather than following the same people as they grow older. www.federalreserve.gov
Ownership helps explain the wider gap. In the 2025 public data, about 46% of Black families owned their primary residence, compared with 75% of White families. About 33% of Black families had retirement accounts, compared with 63% of White families. Stock ownership, including investments held indirectly, was also about 33% for Black families and 65% for White families.
Those differences affect who benefits when homes and investments rise in value. Fed research found that housing drove much of Black wealth growth from 2019 to 2022. Yet Black families’ average cash and other readily available savings declined during that period. A home can gain value while its owner still struggles to cover a bill. federalreserve.gov
Family support also matters. A Fed study using 2019 data found that about 30% of White families had received an inheritance or substantial gift, compared with about 10% of Black families. Help with college, a down payment, or an emergency can make it easier to build and keep wealth. The same research explains how unequal treatment in housing, education, and employment can carry financial effects across generations. federalreserve.gov
These findings help explain the long-term gap. They do not establish exactly what caused the entire recent decline. The survey records the change; it does not assign a share of the loss to each cause. Black average wealth rose about 5% while the median fell, showing why one headline cannot describe every Black family’s experience. federalreserve.gov
Black families have built wealth over time, but the typical family still has a much smaller financial cushion. Closing that gap means paying attention to income, access to assets, debt, and the wealth families can pass to the next generation.
Data note: Historical charts use the Fed’s internal-data tables. Age and ownership figures use public data, which produce slightly different estimates. Black and White categories are non-Hispanic. Dollar comparisons use 2025 dollars. These are survey estimates.