Black Men: Statistics
POPULATION
How Many Black Men Are There?
According the the latest release from the Census ACS demographic data in 2023, there were an estimated 19.5 million Black men in the United States—48% of the Black population, while Black women made up 52%.
| Black Males | All Males | |
|---|---|---|
| Population | 19.5M | 165.7M |
| Median age | 34.3 | 38.1 |
| Percent Compared to Females | ||
| Total | 48% | 50% |
| Under 18 years of age | 25% | 22% |
| 18 to 34 | 11% | 9% |
| 35 to 64 | 29% | 28% |
| 65 and over | 12% | 22% |
How Old Are They?
The median age of Black men was 34.3, about 4 years younger than the 38.1 median for all men nationwide. Over time, Black men are getting older—their median age was 33 in 2018.
Where Are the Youngest Black Men?
25% of Black males were under 18, slightly more than 22% of all males. But by the time they reach older age groups, the percentage of Black men drops faster than it does for other men.
Why the Decline in Older Age Groups?
This decline reflects higher mortality rates for Black men. While men overall live shorter lives than women, Black men are especially affected by health, economic, and social factors over time.
More on population trends…
EDUCATION
Education: Where Black Men Stand
| ages 25 & Up | Black Men | All Men |
|---|---|---|
| Less than high school diploma | 13% | 11% |
| High school graduate | 29% | 27% |
| Some college, no degree | 22% | 19% |
| Associate’s degree | 8% | 8% |
| Bachelor’s degree | 15% | 21% |
| Graduate or professional degree | 8% | 14% |
| Bachelor’s degree and higher | 23% | 35% |
| Attended college | 59% | 66% |
College Attendance
In 2023, 59% of Black men 25 and older had attended college (including those who started but didn’t finish), compared to 66% of all men.
Who’s Earning Degrees?
- 23% of Black men held a bachelor’s degree or higher, compared to 35% of all men.
- 15% of Black men earned a bachelor’s degree, while 21% of all men did.
- 8% earned graduate or professional degrees, about half the national average of 14%.
High School and Beyond
- 13% of Black men didn’t complete high school, down from 15% in 2018. That’s slightly above the national rate for men (11%).
- 29% finished high school only, compared to 27% of all men.
- 8% earned an associate’s degree, matching the national average.
Employment & Income
Are They Working?
Among Black men ages 16 to 64, 64% were in the labor force, compared to 78% of all men. That means they were either employed or actively seeking work.
| ages 16 & up | Black Men | All Men |
|---|---|---|
| Percent who are in the labor force | 64% | 78% |
| Percent of labor force who are employed | 93% | 95% |
| Below poverty level | 19% | 11% |
Who’s Employed?
Of those in the labor force:
- 93% of Black men were employed (vs. 95% of all men).
- 19% of Black men were living below the poverty line, compared to 11% of all men.
Full-Time Work
| ages 16 & up | Black Men | All Men |
|---|---|---|
| Worked full-time, year-round | 45% | 51% |
| Full-time Median earnings for 2023 | $51,266 | $63,975 |
| No earnings all year | 34% | 35% |
| $1 to $9,999 or loss | 2% | 2% |
| $10,000 to $19,999 | 5% | 4% |
| $20,000 to $29,999 | 9% | 9% |
| $30,000 to $49,999 | 24% | 21% |
| $50,000 to $74,999 | 26% | 24% |
| $75,000 or more | 28% | 33% |
| $50,000 or more | 54% | 57% |
Among those 16 and older:
- 45% of Black men worked full-time, year-round (vs. 51% of all men).
- Median full-time earnings were $51,266, up from $49,398 in 2021.
- 34% had no earnings during the year (similar to 35% of all men).
Income Levels
- 54% of Black men earned $50,000 or more (vs. 57% of all men).
- 28% earned $75,000 or more (vs. 33% of all men).
- The biggest group—24%—earned between $30,000 and $49,999.
What Kind of Jobs Do They Work?
- 42% had white collar jobs, like management, education, and office work.
- 38% had blue collar jobs, such as construction, maintenance, and transportation—higher than the 34% national average.
- 20% worked in service jobs, including food service, security, and healthcare support.
| Black Men | All Men | |
|---|---|---|
| White collar | 42% | 53% |
| Blue collar | 38% | 34% |
| Service occupations | 20% | 14% |
Cities Where Black Men with Jobs Outnumber Black Women
Nationwide there are 93 Black men with full-time jobs for every 100 Black women with full-time jobs but that number can vary greatly depending on the location. (See Chart Below)

For example 1. San Diego (167%) has 167 full-time working Black men for every 100 full-time working Black women, while 49. St. Louis (78%) only has 78 full-time working Black men for every 100 full-time working Black women. SEE LIST OF ALL CITIES
RELATIONSHIPS
| ages 15 & up | Black Men | All Men |
|---|---|---|
| Median age at first marriage | 34 | 31 |
| Never married | 51% | 36% |
| Now married (except separated) | 34% | 53% |
| Separated | 3% | 2% |
| Widowed | 2% | 3% |
| Divorced | 10% | 9% |
Marriage & Family: What the Numbers Show
Are Black Men Getting Married?
In 2023:
- 51% of Black men had never been married, while 36% of all men had never married.
- 34% were currently married, compared to 53% of all men.
Separated or Divorced?
- 3% of Black men were separated.
- 10% were divorced, close to the 9% rate for all men.
- 2% were widowed, slightly lower than average.
Who Are They Marrying?
In 2021, about 15% of married Black men had non-Black spouses:
- 8% were married to White women
- 4% to Hispanic women
This number has steadily risen from 8% in 2000 to 15% in 2021.
More about marriage…
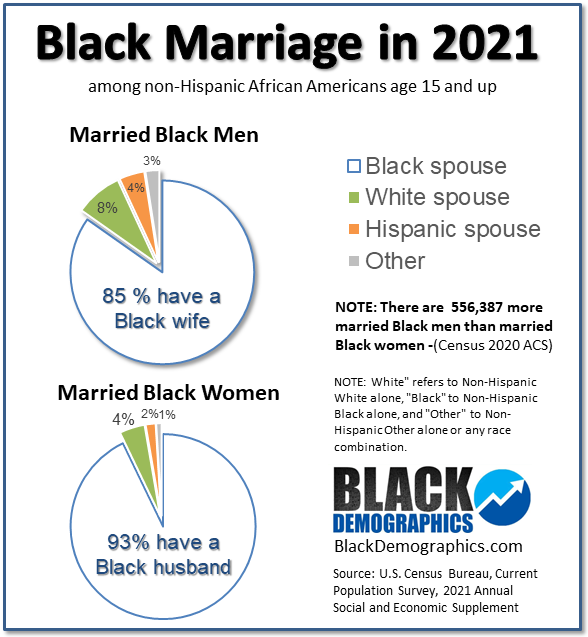
While Black men marry white women at twice the rate that Black women marry White men, in 2021 only 15% percent of married Black men were married to non-Black women which is unchanged from 2017 but up from 11% in 2010 and 8% in 2000. About 8% of married Black men were married to White women in 2021 and 4% were married to Hispanic women. More about Marriage…
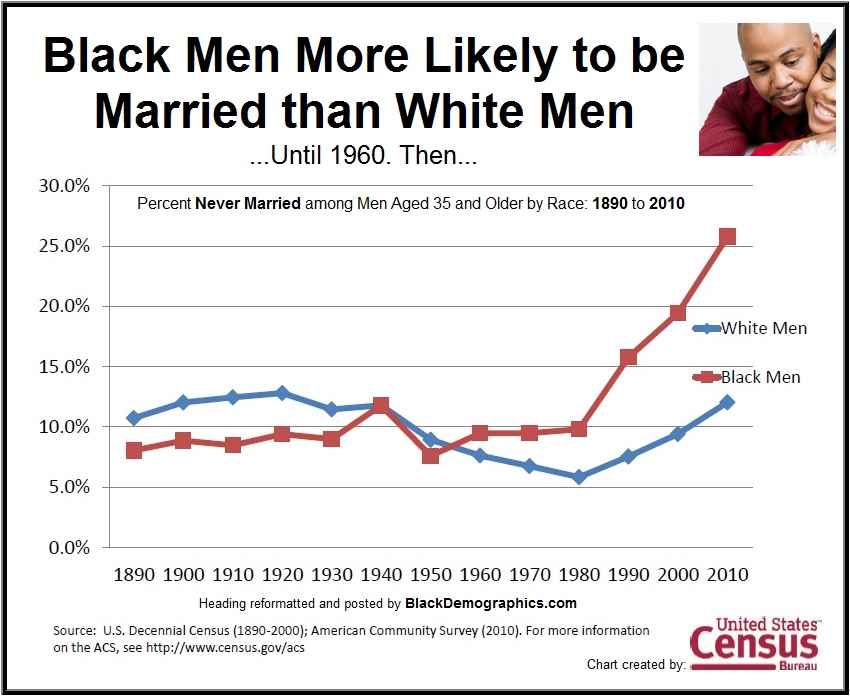
In 2012 The U.S Census Bureau released a report that studied the history of marriage in the United States. They discovered some startling statistics when calculating marriage by race. They found that African Americans age 35 and older were more likely to be married than White Americans from 1890 until sometime around the 1960s. Not only did they swap places during the 60s but in 1980 the number of NEVER married African Americans began a staggering climb from about 10% to more than 25% by 2010 while the percentage remained just over 10% for White men through 2000. The chart above was included in the report only the heading has been altered by BlackDemographics.com to outline these findings.
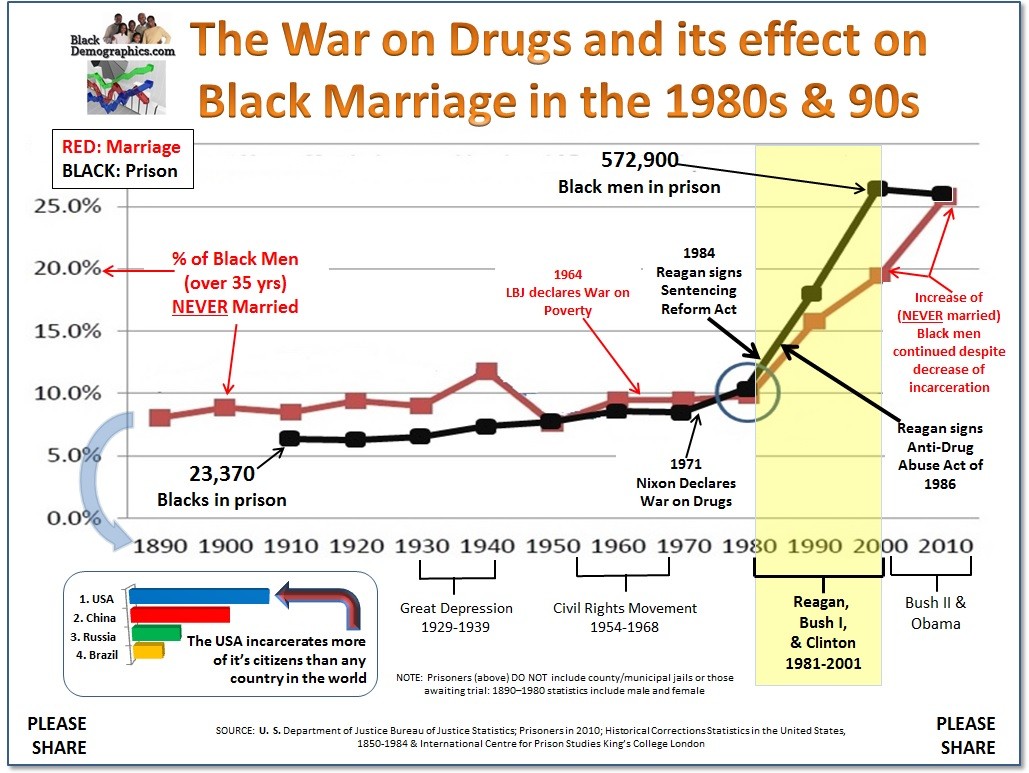
The above chart illustrates how closely the marriage graph for Black men aligns with the incarceration numbers which also experienced an abnormal climb beginning in 1980. This does not prove causation however it shows that they are related due to the assumption that men in prison are less likely to marry.
RELATIONSHIPS
FULL ARTICLE ABOUT BLACK FATHERHOOD/MATHERHOOD FERTILITY
FULL ARTICLE ABOUT BLACK FATHERHOOD/MATHERHOOD FERTILITY
NOTE: Data Below is from 2013 or before. It has yet to be updated.
OTHER CHARACTERISTICS
In 2013 about 6% of working-age (18-64yrs old) Black men were in state or federal prison, or in a municipal jail (see chart right). This was three times higher than the 2% of ‘all men’ in the same age group. What’s even more concerning is that approximately 34%* of all working-age Black men who were not incarcerated were ex-offenders compared to 12% of ‘all men’ which means they have at one point in their lives been convicted of a felony. This data coincides with the increased absence of Black men in the labor force because ex-offenders are prevented from obtaining a large percentage of occupations either by law and are often legally discriminated against by private employers.
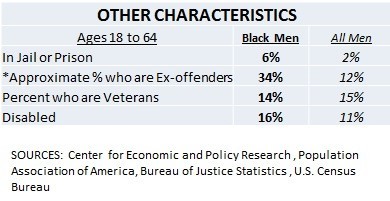
*IMPORTANT NOTE: Ex-offender calculations have a larger range of uncertainty than most due to the range of factors and degree of variance of each sources methodology. Recidivism (repeat offending), unknown death rates, and difference in state reporting methods are some of the factors contributing to this uncertainty. Sources from 1998-2008)
In 2013 Fourteen percent of working-age Black men were veterans of U.S. military which was just slightly lower than all male veterans (15%). A larger percentage of working age Black men were considered disabled (16%) compared to ‘all men’ (11%).