

What do income, homeownership, home values and housing costs tell us about the economic position of Black households in four of the nation’s largest Black metropolitan areas?
Where are the strongest housing opportunities for Black households?
The answer depends on what you measure.
Higher household income can provide greater purchasing power, but it may come with higher home prices. Lower home values can make homeownership more accessible, but lower incomes can offset some of that advantage. And even in relatively affordable markets, homeowners and renters may still devote a substantial share of their income to housing.
BlackDemographics.com’s Black Metro Housing Comparisons series examines these differences using 2025 population estimates and 2024 American Community Survey housing characteristics for the Black population.
This first look compares four of the nation’s largest Black metropolitan populations: Atlanta, Washington, Dallas-Fort Worth and Houston.
Rather than attempting to name a single “best” metro, the data reveal four housing markets with different strengths, costs and potential opportunities for Black households.
Atlanta vs. Washington: Two Different Housing Profiles
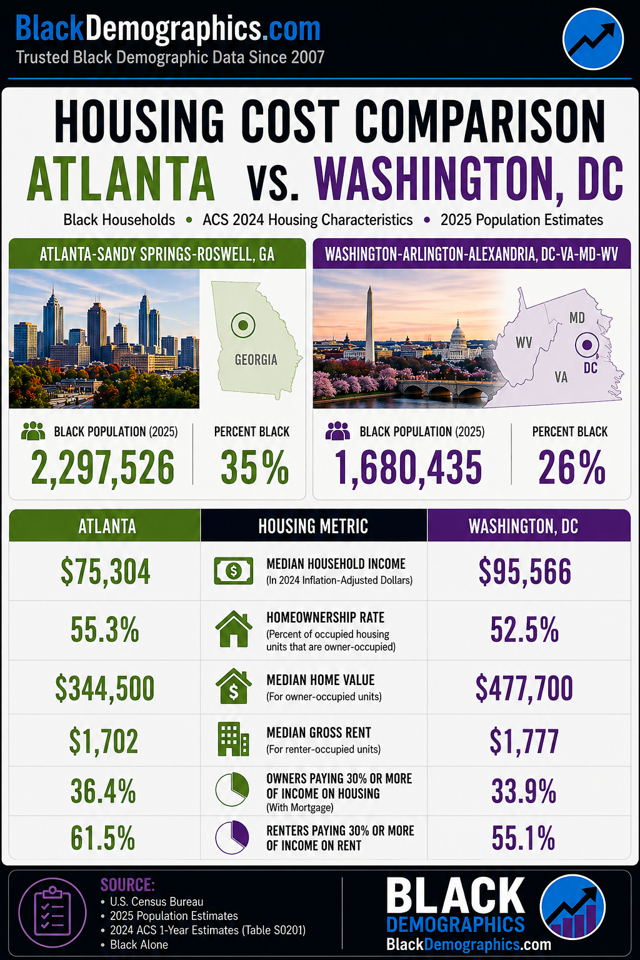
The Atlanta and Washington metropolitan areas contain two of the largest concentrations of Black residents in the United States, but their housing and economic profiles differ considerably.
The Atlanta-Sandy Springs-Roswell metropolitan area had an estimated 2.30 million Black residents in 2025, representing approximately 35% of the metropolitan population. The Washington-Arlington-Alexandria metropolitan area had approximately 1.68 million Black residents, or 26% of its population.
Atlanta has the larger Black population and a higher Black homeownership rate, while Washington stands out for substantially higher household incomes and home values.
Median household income among Black households was $95,566 in the Washington metro compared with $75,304 in Atlanta.
The difference is even larger when looking at home values. The median value of an owner-occupied home among Black households was $477,700 in Washington compared with $344,500 in Atlanta.
That $133,200 difference is significant because home equity is an important component of household wealth. Black homeowners in the Washington metropolitan area are participating in a considerably higher-value housing market.
But Atlanta has an important advantage of its own: more Black households are homeowners.
The Black homeownership rate was 55.3% in Atlanta compared with 52.5% in Washington.
Atlanta also offers a lower financial barrier to entering the housing market. Its median home value is substantially lower, while median gross rent was $1,702 compared with $1,777 in Washington.
Housing burden adds another dimension
Higher housing prices do not automatically mean that households experience greater housing-cost pressure.
Among Black homeowners with a mortgage, 33.9% in Washington spent 30% or more of their income on housing, compared with 36.4% in Atlanta.
The difference is even greater among renters.
Approximately 55.1% of Black renters in Washington spent at least 30% of household income on rent, compared with 61.5% in Atlanta.
That suggests Washington’s considerably higher Black household incomes may help compensate for the metro’s more expensive housing market.
The result is an interesting contrast: Atlanta offers lower housing prices and higher Black homeownership, while Washington combines higher incomes and much higher home values with lower housing-cost burdens.
Dallas vs. Houston: Higher Income or Lower Housing Costs?
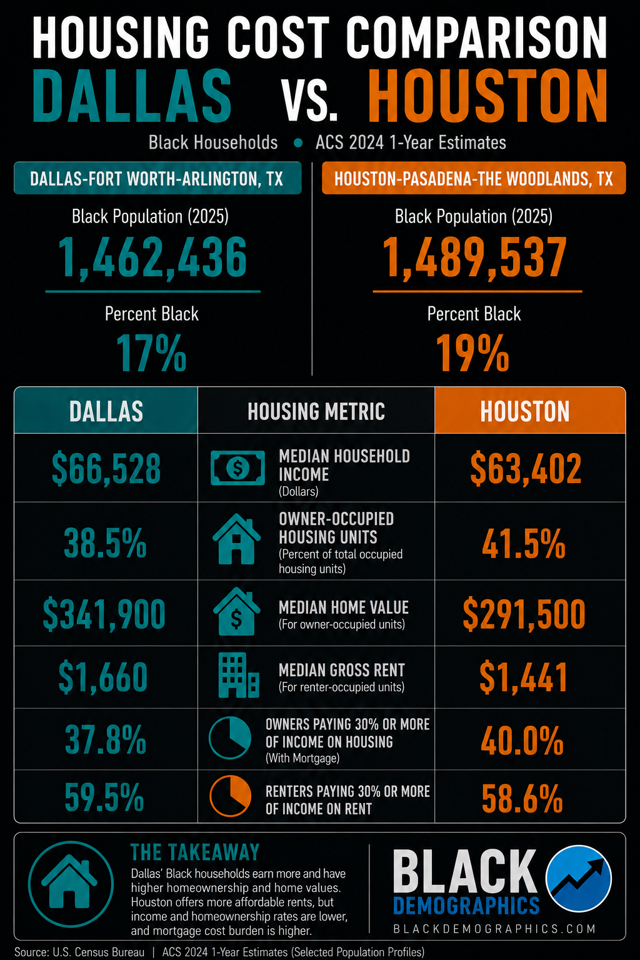
Dallas-Fort Worth and Houston provide another revealing comparison.
Their Black populations are remarkably close in size.
In 2025, the Houston-Pasadena-The Woodlands metropolitan area had approximately 1.49 million Black residents, representing 19% of the metro population. The Dallas-Fort Worth-Arlington metropolitan area had approximately 1.46 million, representing 17%.
But their housing characteristics show important differences.
Black median household income was $66,528 in Dallas-Fort Worth compared with $63,402 in Houston.
Dallas also had substantially higher median home values: $341,900 compared with $291,500 in Houston.
Yet despite having lower household income, Houston had the higher Black homeownership rate: 41.5% compared with 38.5% in Dallas-Fort Worth.
Houston also had considerably lower rents.
Median gross rent among Black renter households was $1,441 in Houston compared with $1,660 in Dallas-Fort Worth.
The trade-off becomes clearer when housing burden is considered.
Among Black homeowners with mortgages, 37.8% in Dallas spent 30% or more of household income on housing compared with 40.0% in Houston.
Among renters, however, Houston held a slight advantage: 58.6% were rent burdened compared with 59.5% in Dallas.
Dallas therefore combines higher incomes and higher-value homes with a somewhat lower mortgage burden, while Houston combines lower home prices and rents with a higher Black homeownership rate.
How Do All Four Black Metros Compare?
Looking at all four metropolitan areas together provides a broader picture.
| Housing & Demographic Measure | Atlanta | Washington | Dallas-Fort Worth | Houston |
|---|---|---|---|---|
| Black Population (2025) | 2,297,526 | 1,680,435 | 1,462,436 | 1,489,537 |
| Percent Black | 35% | 26% | 17% | 19% |
| Median Household Income | $75,304 | $95,566 | $66,528 | $63,402 |
| Black Homeownership Rate | 55.3% | 52.5% | 38.5% | 41.5% |
| Median Home Value | $344,500 | $477,700 | $341,900 | $291,500 |
| Median Gross Rent | $1,702 | $1,777 | $1,660 | $1,441 |
| Owners Spending 30%+ | 36.4% | 33.9% | 37.8% | 40.0% |
| Renters Spending 30%+ | 61.5% | 55.1% | 59.5% | 58.6% |
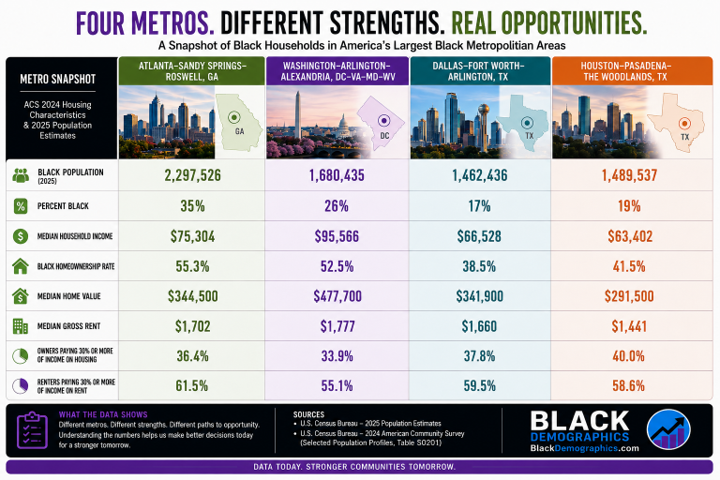
Which Metro Has the Largest Black Population?
Atlanta.
With approximately 2.30 million Black residents, Atlanta has by far the largest Black population among these four metropolitan areas.
Atlanta also has the highest Black share of the overall metropolitan population at 35%.
Washington ranks second among the four with approximately 1.68 million Black residents, followed by Houston and Dallas-Fort Worth.
Where Are Black Household Incomes Highest?
Washington.
At $95,566, median household income among Black households in the Washington metropolitan area is substantially higher than in the other three metros.
Atlanta ranks second at $75,304, followed by Dallas at $66,528 and Houston at $63,402.
Washington’s Black median household income is approximately $32,000 higher than Houston’s, the lowest of the four.
That difference helps explain another seemingly contradictory finding: Washington has the most expensive housing of the four metros but the lowest rates of housing-cost burden.
Where Is Black Homeownership Highest?
Atlanta.
Approximately 55.3% of occupied Black housing units in Atlanta are owner-occupied, followed closely by Washington at 52.5%.
There is then a considerable drop to Houston at 41.5% and Dallas-Fort Worth at 38.5%.
This is particularly noteworthy when Atlanta and Washington are compared. Washington households have considerably higher incomes, yet Atlanta maintains the higher Black homeownership rate.
The same pattern appears in Texas: Dallas has higher Black household income than Houston, but Houston has the higher Black homeownership rate.
In both comparisons, higher income does not automatically translate into higher homeownership.
Where Are Homes Most Valuable?
Washington, by a considerable margin.
The median Black owner-occupied home value in Washington was $477,700.
Atlanta and Dallas are surprisingly close at $344,500 and $341,900, respectively.
Houston is considerably lower at $291,500.
For existing homeowners, higher home values can translate into greater accumulated housing equity and wealth. But for prospective homeowners, those same prices can create a larger barrier to purchasing a home.
That distinction is important.
A high-value housing market can simultaneously represent greater wealth for existing homeowners and a more difficult entry point for prospective buyers.
Where Is Housing Least Expensive?
Houston clearly stands out on direct housing costs.
Houston has both the lowest median home value ($291,500) and the lowest median gross rent ($1,441) among the four metropolitan areas.
That helps distinguish Houston from Dallas despite the two metros having similarly sized Black populations.
Dallas Black households earn more, but Houston housing costs considerably less.
Atlanta occupies an interesting middle position. Its median home value is nearly identical to Dallas, despite Atlanta having considerably higher Black household income and a much higher Black homeownership rate.
Where Are Homeowners Least Burdened by Housing Costs?
Surprisingly, Washington.
Only 33.9% of Black homeowners with mortgages in Washington spend 30% or more of household income on housing, the lowest percentage among these four metropolitan areas.
Atlanta follows at 36.4%, Dallas at 37.8%, and Houston at 40.0%.
This is an important reminder that affordability cannot be determined by looking at home prices alone.
Washington has the most expensive homes, but its much higher Black household incomes appear to provide greater capacity to absorb those costs.
What About Black Renters?
Washington again has the lowest housing-cost burden.
Approximately 55.1% of Black renters in Washington spend 30% or more of household income on rent.
Houston follows at 58.6%, Dallas at 59.5%, and Atlanta has the highest rate at 61.5%.
The Atlanta number is particularly notable because Atlanta’s rents are lower than Washington’s.
Again, the relationship between income and housing costs matters more than either statistic by itself.
Four Metros, Different Strengths
There is no obvious winner when all eight measures are considered.
Instead, each metropolitan area presents a different profile.
Atlanta combines the largest Black population, the highest Black homeownership rate and housing costs considerably below Washington’s. Its major challenge in this comparison is housing-cost burden, particularly among renters.
Washington stands apart economically. Black households have the highest median income, homeowners hold the highest-value homes, and both homeowners and renters experience the lowest rates of housing-cost burden among the four metros. The trade-off is a much more expensive housing market.
Dallas-Fort Worth offers higher Black household income than Houston and substantially higher home values, while its homeowners experience somewhat less mortgage cost burden. However, it has the lowest Black homeownership rate among the four metros.
Houston offers the lowest home prices and rents and a higher Black homeownership rate than Dallas. However, it also has the lowest median Black household income and the highest mortgage cost burden among Black homeowners in this comparison.
These differences illustrate why identifying the “best” metropolitan area for Black households depends heavily on what a household is trying to accomplish.
A renter looking for lower monthly costs may evaluate these cities differently from a first-time homebuyer. An existing homeowner interested in long-term appreciation may have different priorities from a household seeking the lowest possible entry price.
Does a More Expensive Housing Market Mean Greater Black Wealth?
Not necessarily—but it raises an important question.
Washington’s combination of high household income, high home values and relatively low housing-cost burdens suggests significant wealth-building potential for Black homeowners.
But home values alone do not measure household wealth.
Determining whether Black homeowners in Washington actually possess greater net wealth than homeowners in Atlanta, Dallas or Houston would require additional information about mortgage debt, home equity, retirement savings, other assets and household liabilities.
Likewise, Atlanta’s higher homeownership rate means a larger share of Black households may have access to home equity as a wealth-building asset, even though the typical home is worth less than in Washington.
These are precisely the kinds of differences the Black Metro Housing Comparisons series will continue to explore.
What Should BlackDemographics Compare Next?
This is only the beginning.
New York, Chicago, Philadelphia, Miami, Detroit, Los Angeles and other metropolitan areas contain some of the largest Black communities in the United States and present very different combinations of income, housing costs, homeownership and affordability.
Future Black Metro Comparisons will expand the analysis to additional metropolitan areas and examine how these patterns differ across the country.
The objective is not simply to identify where housing is cheapest or where incomes are highest.
It is to provide the data necessary to ask a more useful question:
Where are Black households finding the strongest combinations of economic opportunity, housing affordability and the ability to build long-term wealth?
About the Data
Population figures represent the Black Alone population from U.S. Census Bureau 2025 Population Estimates.
Housing and household characteristics are from the U.S. Census Bureau 2024 American Community Survey 1-Year Estimates, Selected Population Profiles (Table S0201) for the Black or African American Alone population.
The housing-cost burden measures represent the percentage of homeowners with a mortgage or renters spending 30% or more of household income on housing costs.
Sources
U.S. Census Bureau
- 2025 Population Estimates
- 2024 American Community Survey, 1-Year Estimates
- Selected Population Profiles, Table S0201
- Black or African American Alone