

Norfolk–Virginia Beach, VA
The Norfolk–Virginia Beach Metropolitan Area has the 14th largest Black population in the United States.
| Metropolitan Area Data | Black | Total Metro |
| Population | 529,075 | 1,724,388 |
| Median household income | 46,047 | 64,255 |
| Family poverty rate | 16.2% | 8.8% |
| Bachelor’s degree or higher | 22.7% | 32.1% |
| Married-couple family households | 31.7% | 47.6% |
| Homeowner rate | 44.7% | 62.0% |
SOURCE: 2017 American Community Survey 1-Year Estimates
Download the Complete African American Population Report for:
Norfolk – Newport News – Virginia Beach VA Metro
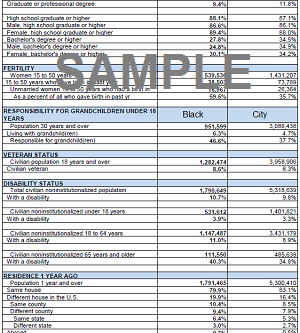
The report consists of data tables compiled from the 2011 American Community Survey 1-Year Estimates and compares the Black Metropolitan population to the total Metropolitan population all in one 8 page report for $2.99. (see below for report details)
This report includes 289 data comparisons regarding 33 topics including:
- Total number reported
1 data comparison - Sex and age
19 data comparisons - Relationship
6 data comparisons - Households by type
18 data comparisons - Marital status
18 data comparisons - Responsibility for grandchildren
3 data comparisons - School enrollment status
12 data comparisons - Educational attainment
12 data comparisons - Class of workers
5 data comparisons - Commuting to work
8 data comparisons - Employment status
14 data comparisons - Occupation
18 data comparisons - Industry
14 data comparisons - Poverty rates for families and people
19 data comparisons - Income
30 data comparisons - Housing tenure
5 data comparisons - Monthly owner costs as a percentage of household income
3 data comparisons - Owner characteristics
4 data comparisons - Gross rent as a percentage of household income
3 data comparisons - Gross rent
2 data comparisons - Units in structure
5 data comparisons - Year structure built
7 data comparisons - House heating fuel
5 data comparisons - Selected characteristics
3 data comparisons - Residence 1 year ago
8 data comparisons - Place of birth, citizenship status and year of entry
16 data comparisons - World region of birth of foreign born
7 data comparisons - Language spoken at home and ability to speak English
4 data comparisons - Fertility
4 data comparisons - Veteran status
2 data comparisons - Disability status
8 data comparisons - Health insurance coverage
4 data comparisons - Vehicles available
3 data comparisons
Norfolk–Virginia Beach, VA metropolitan Population Report (289 data comparisons regarding 33 topics)
Download Now $2.99 (click below)
Request by Email Only: akiim.deshay@onlymoveforward.com![]()
For any questions or issues related to viewing and/or downloading this report contact:
akiim.deShay@onlymoveforward.com
| These Transactions |
For any questions or issues related to viewing and/or downloading this report contact:
akiim.deShay@onlymoveforward.com
![]()