

Black Political Engagement: From Reconstruction to the Modern Era
African Americans have played a significant role in both major political parties in the United States. After the Civil War, most African Americans identified as Republicans because the party was founded by abolitionists and was led by President Abraham Lincoln. In contrast, Southern Democrats were against granting rights to African Americans and didn’t allow them to officially attend the Democratic convention until 1924.
Reconstruction and a Quest for Civil Rights (1865-1877)
The Reconstruction Era was a transformative period following the Civil War, marked by efforts to rebuild the United States, integrate formerly enslaved African Americans into political, economic, and social life, and redefine the nation’s laws and social structures to embrace equality and civil rights.
During Reconstruction, 16 African Americans served in the U.S. Congress, more than 600 were elected to state legislatures, and hundreds more held local offices across the South. In total, approximately 2,000 African Americans held public office, including positions up to the U.S. Senate, many of whom had been born into slavery before the war.
The end of the Reconstruction Era was primarily brought about by the Compromise of 1877, an agreement that resolved the disputed 1876 presidential election, withdrawing federal troops from Southern states, effectively ending federal efforts to protect the rights of African Americans.
Post-Reconstruction Setbacks Jim Crow, and the Lily White Movement**
Following Reconstruction, the Lily White Movement within the Republican Party sought to exclude African Americans from positions of influence. This movement was part of a broader effort to appeal to white voters in the South by reducing Black political representation, occurring concurrently with the Democratic Party’s implementation of Jim Crow laws that disenfranchised Black voters. These laws effectively shut out African Americans from political power in the South, regardless of party affiliation. This period was also defined by a significant push for civil and political rights, despite opposition from Black codes and violent groups like the Ku Klux Klan.
The New Deal and Shifting Political Allegiances (1930s)
The Great Depression marked a shift as President Franklin Roosevelt’s New Deal policies attracted Black voters outside of the Jim Crow South to the Democratic Party. Despite widespread disenfranchisement under Jim Crow, African Americans elsewhere began to realign politically, with a substantial majority voting for Roosevelt.
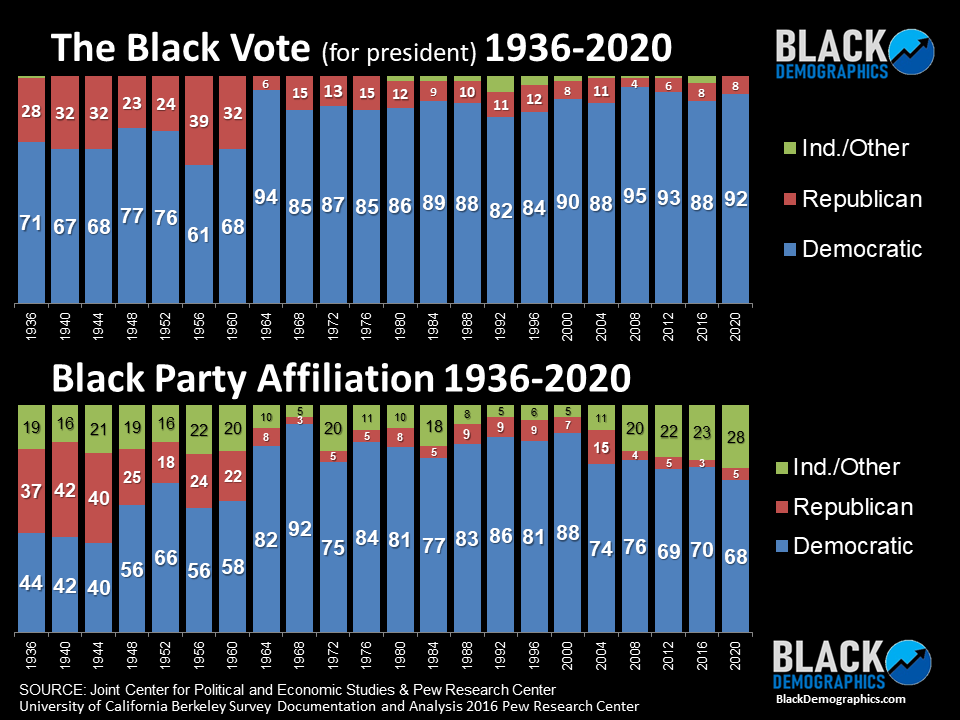
President Franklin Roosevelt’s New Deal program helped disadvantaged communities, including some minorities, find work. As a result, 71% of African Americans voted for a Democratic president, although only 44% considered themselves members of the Democratic Party. In 1948, President Harry Truman, a Democrat, ordered the desegregation of the military and issued an executive order against racial discrimination in federal employment, which won over many Black voters. By this time, 56% of African Americans were Democrats.. cont below chart
Civil Rights Era and Democratic Loyalty (1948-1960s)
Democratic support for civil rights legislation, such as the Civil Rights Act of 1964 and the Voting Rights Act of 1965, solidified African American support for the party. This was highlighted by the overwhelming Black vote for President Lyndon B. Johnson, despite the lingering effects of Jim Crow in the South. Johnson’s Republican opponent, Barry Goldwater, opposed the Civil Rights Act, leading to Johnson receiving a record 94% of the Black vote.
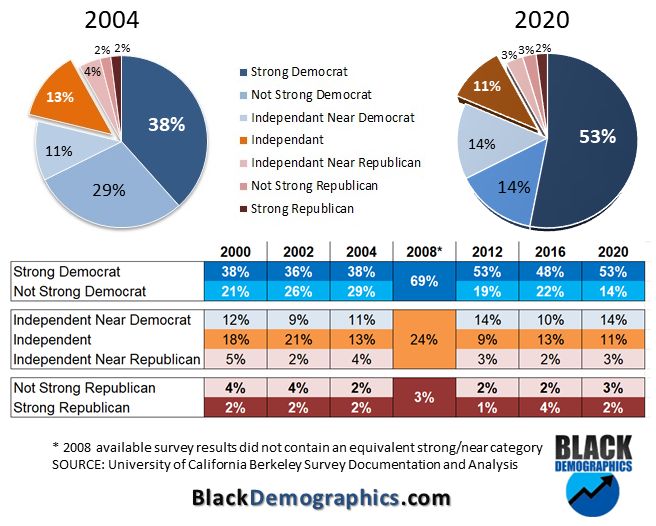
From this point on, the majority of African Americans became Democrats, with a notable shift by 2016 when only 8% identified as Republicans. However, despite 88% casting their votes for Hillary Clinton in 2016, just 70% felt aligned with the Democratic Party.
Gerald Ford received the highest percentage of Black votes for a Republican since 1968, at 15% in 1976.
The year 2004 marked a significant point, with more African Americans identifying as Republicans than any time since 1960, and as independents more than any time since 1984, indicating a readiness among some Black voters to explore different political affiliations.
Yet, being the first and hardest hit by the economic downturn and Barack Obama’s compelling 2008 campaign led to unprecedented support for the Democratic nominee among African Americans.
Nevertheless, the trend of African Americans identifying as Independent has grown, mirroring a national movement towards rejecting the binary party system, due in part to a history of feeling marginalized by both parties. Currently, while the majority still support Democratic candidates, about 30% of African American voters identify as independent, showcasing a complex and evolving political identity.
Conclusion
The journey of African American political engagement has been shaped by the quest for autonomy during Reconstruction, opposition through the Jim Crow and Lily White Movement eras, and a redefinition of political identity with the rise of independent voters. This complex history underscores the dynamic nature of political affiliations among African Americans and the importance of understanding the independent electorate’s role in shaping the future of American politics.
Sources
This account relies on data and historical records from the Joint Center for Political and Economic Studies, Pew Research Center, HISTORY.com, and the University of California Berkeley Survey Documentation and Analysis. It acknowledges the diversity of polling methodologies and interpretations over time.
—
NOTE: Voting statistics are driven by polls and/or surveys which are conducted by several different news agencies and political organizations. This is why results of polls may differ depending on source used.