Black Women: Statistics
Understanding the Black Female Population in the U.S.
| Black Women | All Women | |
|---|---|---|
| Population | 21.1M | 169.2M |
| Median age | 37.6 | 40.3 |
| Total | 52% | 51% |
| Under 18 years of age | 22% | 20% |
| 18 to 34 | 9% | 9% |
| 35 to 64 | 29% | 28% |
| 65 and over | 15% | 25% |
What the Numbers Say:
How Many Are There?
As of 2023, there were approximately 21.1 million Black women in the United States. This makes up 52% of the total Black population, compared to 48% who are Black men.
Age Matters
The median age for Black women is 37.6 years, which is slightly younger than the median age for all women, which is 40.3 years.
Young Girls
22% of Black women are under the age of 18. This is nearly the same as 20% of all women in that age group nationwide.
Growing Older
The percentage of women rises noticeably in older age groups. For example, 15% of Black women are age 65 or older, while only 12% of Black men fall into that group. This is part of a broader trend where women tend to outnumber men in older age brackets due to differences in average lifespan.
More insights on population trends…
Educational Attainment (25 & Up)
| Black Women | All Women | |
|---|---|---|
| Less than high school diploma | 10% | 4% |
| High school graduate | 24% | 25% |
| Some college, no degree | 23% | 19% |
| Associate’s degree | 10% | 10% |
| Bachelor’s degree | 17% | 22% |
| Graduate or professional degree | 13% | 15% |
| Bachelor’s degree and higher | 29% | 37% |
| Attended college | 65% | 66% |
Education: Key Points
College Attendance
In 2023, 65% of Black women age 25 and older had attended college (including those who started but did not complete a degree). This compares closely to 66% of all women in the same age group.
Degree Comparison
- 29% of Black women had a bachelor’s degree or higher, compared to 37% of all women.
- 17% of Black women held a bachelor’s degree, while 13% held a graduate or professional degree.
- 10% had an associate’s degree, which is equal to the share for all women.
High School Only
24% of Black women completed high school but did not attend college, slightly below 25% of all women.
Compared to Black Men
Black women continue to have higher college completion rates than Black men. As of 2023, 29% of Black women held a bachelor’s degree or higher, compared to 23% of Black men.
More about education…
Marital Status (15 & Up)
| Black Women | All Women | |
|---|---|---|
| Median age at first marriage | – | – |
| Never married | 49% | 31% |
| Now married (except separated) | 27% | 47% |
| Separated | 3% | 2% |
| Widowed | 8% | 8% |
| Divorced | 13% | 12% |
❤️ Understanding the Numbers on Marriage
Never Married
49% of Black women age 15 and older have never been married, compared to 31% of all women in the U.S.
Currently Married
Only 27% of Black women were currently married in 2023, significantly lower than the 47% of all women nationwide.
Separated or Divorced
- 3% of Black women were separated (vs. 2% of all women).
- 13% of Black women were divorced, just above the 12% rate for all women.
Compared to Black Men
There are about 364,000 more Black men who are married than Black women, even though women make up the majority of the Black population.
Interracial Marriage Trends
- In 2021, about 94% of married Black women were married to Black men.
- About 86% of married Black men were married to Black women.
More about marriage…
Earnings & Employment
| ages 16 to 64 | Black Women | All Women |
|---|---|---|
| Percent who are in the labor force | 75% | 70% |
| Percent of labor force who are employed | 91% | 94% |
| Below poverty level | 22% | 14% |
| ages 16 and Up | Black Women | All Women |
|---|---|---|
| Worked full-time, year-round | 43% | 38% |
| Median earnings for full-time in 2023 | $46,788 | $52,370 |
| No earnings all year | 35% | 38% |
| $1 to $9,999 or loss | 2% | 2% |
| $10,000 to $19,999 | 5% | 3% |
| $20,000 to $29,999 | 10% | 10% |
| $30,000 to $49,999 | 24% | 20% |
| $50,000 to $74,999 | 24% | 17% |
| $75,000 or more | 22% | 30% |
| $50,000 or more | 47% | 47% |
Occupation Type
| Black Women | All Women | |
|---|---|---|
| White collar | 65% | 73% |
| Blue collar | 10% | 8% |
| Service occupations | 25% | 20% |
Employment: Main Points
Labor Force Participation
In 2023, 75% of Black women ages 16 to 64 were in the labor force—meaning they were either working or actively looking for work. This is higher than the rate for all women, which was 70%.
Who Isn’t Working?
Women not in the labor force may include those who are full-time students, caregivers, retired, or not actively seeking work for other personal or health reasons.
Earnings
Black women who worked full-time, year-round in 2023 had median earnings of $46,788. This is lower than the median for all women, which was $52,370.
No Earnings
35% of Black women age 16 and older had no earnings in 2023, slightly lower than the 38% of all women with no earnings that year.
Income Breakdown
- 47% of Black women earned $50,000 or more, equal to all women at 47%.
- 22% earned $75,000 or more, compared to 30% of all women.
Types of Jobs
- 65% of working Black women held white collar jobs, such as in management, education, business, or health professions.
- 10% worked in blue collar roles, including maintenance, construction, and transportation.
- 25% were in service occupations, such as healthcare support, food preparation, and protective services—higher than 20% of all women in these roles.
More on employment trends…
More Insights on Population Trends…
(note that numbers may not add up to 100% because of rounding)
Main Points:
RELATIONSHIPS
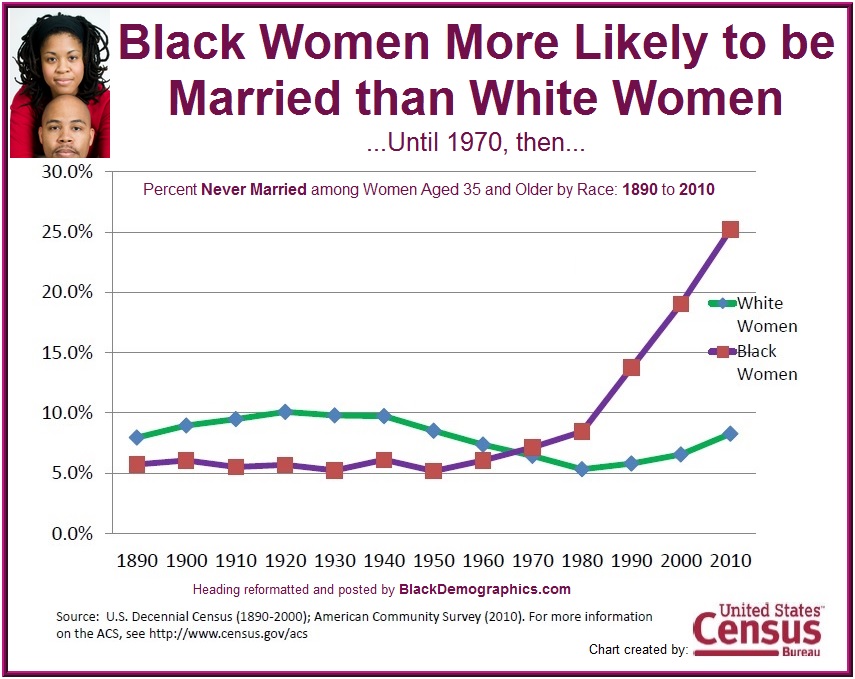
Black women are less likely to be married than Black men. As a matter of fact there are about 364,000 more Black men who are married than Black women even though Black women are 51% of the Black population. While an overwhelming percentage of Black women are married to Black men (94%), about 86% of Black men are married to Black women.
More about Marriage…
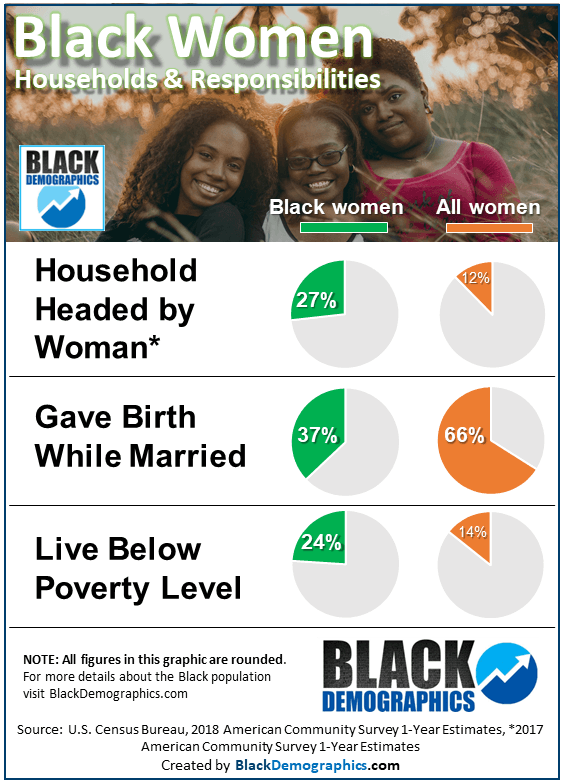
OTHER CHARACTERISTICS
Black women are the head of 27% of all Black households in 2018 which is more than twice the rate for ‘all women’ at 12 percent. These are households defined by the U.S. Census Bureau as having a female head and no spouse present. Only 37% of Black women who gave birth were married which is almost the opposite for ‘all women’ at 66%. These are some of the issues factor into a much higher poverty rate of 24% for Black women compared to a 14% poverty rate for all women.
These additional responsibilities may also explain why Black women are slightly over-represented in the workforce compared to all women.