

Cleveland, OH
The Cleveland Metropolitan Area has the 17th largest Black population in the United States with 410,657 African Americans making up 20% of the Metropolitan total. Source: Census Bureau 2017 American Community Survey 1-Year Estimate.
| Metropolitan Area Data | Black | Total Metro |
| Population | 410,657 | 2,058,844 |
| Median household income | $29,661 | $52,489 |
| Family poverty rate | 27.4% | 10.7% |
| Bachelor’s degree or higher | 15.6% | 30.8% |
| Married-couple family households | 18.3% | 41.6% |
| Homeowner rate | 35.4% | 64.4% |
African Americans have been in Cleveland since the early 1800s. The post Civil War migration brought the first significant wave of Black migrants from the South. The Black population was 10,000 by World War I and 72,000 by the beginning of the “Great Depression” in 1930. World War II brought more demand for Black laborers. In 1940 the Black population was 85,000 and by 1960 it had swelled to close to a quarter million.
Download the Complete African American Population Report for:
Cleveland-Elyria-Mentor, OH Metro
The report consists of data tables compiled from the 2017 Census Bureau American Community Survey 1-Year Estimates and compares the metropolitan area Black population to the total metropolitan area population all in one 16-page report. (purchase below)
This report includes 289 data comparisons regarding 33 topics 26 charts and graphs including:
- Total number reported
1 data comparison - Sex and age
19 data comparisons - Relationship
6 data comparisons - Households by type
18 data comparisons - Marital status
18 data comparisons - Responsibility for grandchildren
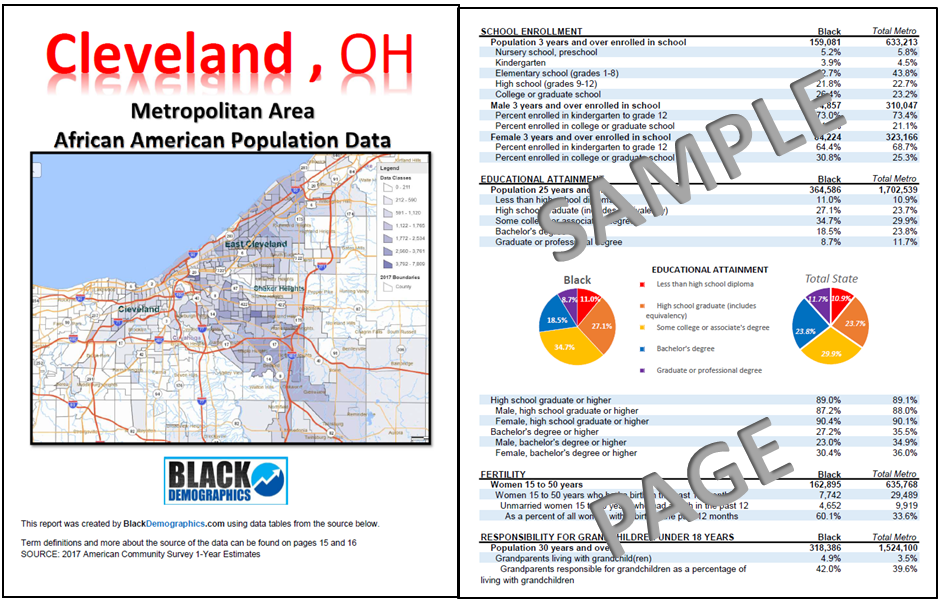
3 data comparisons - School enrollment status
12 data comparisons - Educational attainment
12 data comparisons - Class of workers
5 data comparisons - Commuting to work
8 data comparisons - Employment status
14 data comparisons - Occupation
18 data comparisons - Industry
14 data comparisons - Poverty rates for families and people
19 data comparisons - Income
30 data comparisons - Housing tenure
5 data comparisons - Monthly owner costs as a percentage of household income
3 data comparisons - Owner characteristics
4 data comparisons - Gross rent as a percentage of household income
3 data comparisons - Gross rent
2 data comparisons - Units in structure
5 data comparisons - Year structure built
7 data comparisons - House heating fuel
5 data comparisons - Selected characteristics
3 data comparisons - Residence 1 year ago
8 data comparisons - Place of birth, citizenship status and year of entry
16 data comparisons - World region of birth of foreign born
7 data comparisons - Language spoken at home and ability to speak English
4 data comparisons - Fertility
4 data comparisons - Veteran status
2 data comparisons - Disability status
8 data comparisons - Health insurance coverage
4 data comparisons - Vehicles available
3 data comparisons
Cleveland Population Report (289 data comparisons regarding 33 topics and 26 charts and graphs)
Download Now $4.99 (click Buy Now)
For any questions or issues related to viewing and/or downloading this report contact:
akiim.deShay@onlymoveforward.com
| These Transactions |
For any questions or issues related to viewing and/or downloading this report contact:
akiim.deShay@onlymoveforward.com
![]()