

Foreign-Born Black Population by Metro Area: Regional Highlights
The 2023 American Community Survey data reveals significant differences in the share of foreign-born Black populations across major U.S. metro areas. Here’s a look at the top metros by region:
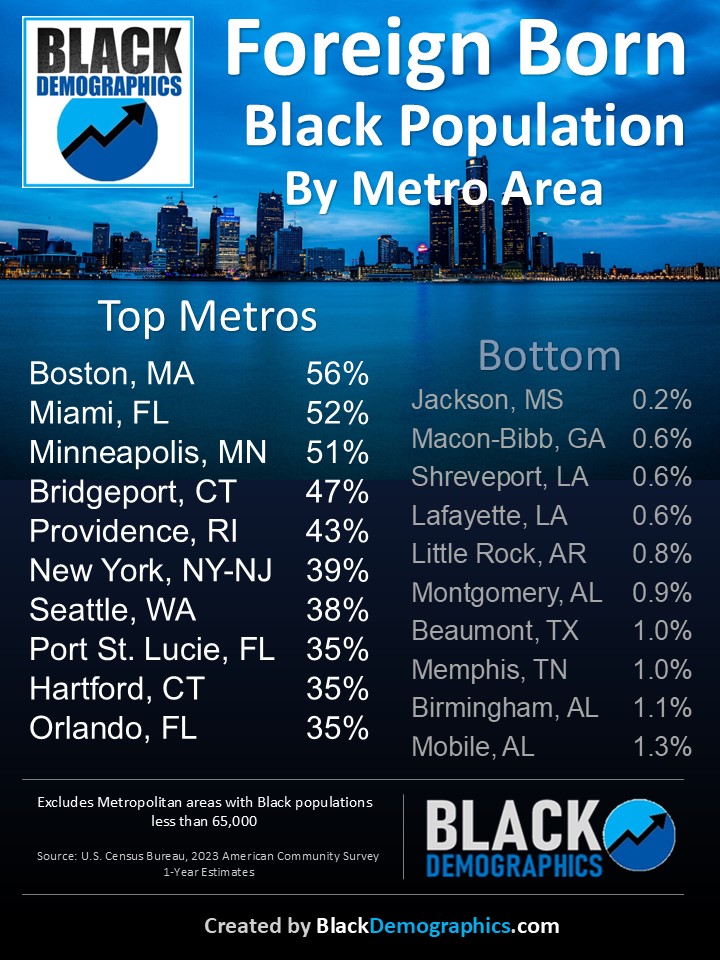
Northeast
Boston leads the nation with 56% of its Black population being foreign-born. Much of this population comes from the Caribbean, particularly Haiti and Cape Verde. Bridgeport, CT follows with 47%, also reflecting a large Caribbean-born community. Providence, RI ranks at 43%, similar to Boston with notable Cape Verdean and Dominican Black populations. New York City comes in at 39%, with a diverse foreign-born Black population from the Caribbean (Jamaica, Haiti, Trinidad) and Africa (Nigeria, Ghana). This put the New York foreign born Black population close to 1.5 million out of the total 3,823,081 total metro Black population
Hartford, CT also makes the list at 35%, with a significant West Indian Black population, particularly Jamaicans.
South
Miami ranks second overall and leads the South with more than half (52%) of its Black population foreign-born, primarily from Haiti, Jamaica, and other Caribbean nations. Port St. Lucie, FL and Orlando, FL each report 35%, reflecting similar Caribbean migration patterns into central and southern Florida.
Midwest
Minneapolis stands out in the Midwest with 51% of its Black population being foreign-born. This group is largely made up of East African immigrants, particularly from Somalia and Ethiopia, making it a unique demographic compared to other top metros.
West
Seattle rounds out the top metros with 38% of its Black population foreign-born. The foreign-born Black community here is diverse, including immigrants from Ethiopia, Eritrea, and Somalia, along with smaller Caribbean and West African populations.
Bottom Metros
At the other end of the spectrum are metros where foreign-born Black populations make up less than 1.5% of the Black population. These include Jackson, MS (0.2%), Macon-Bibb, GA (0.6%), Shreveport, LA (0.6%), and others across the Deep South. These areas reflect longstanding native-born Black populations with little foreign-born growth.
This data excludes metro areas with fewer than 65,000 Black residents.
Source: U.S. Census Bureau, 2023 American Community Survey 1-Year Estimates
| Metro Area | % Foreign Born |
|---|---|
| Boston, MA-NH | 56% |
| Miami, FL | 52% |
| Minneapolis, MN-WI | 51% |
| Bridgeport, CT | 47% |
| Providence, RI-MA | 43% |
| NYC-Newark, NY-NJ | 39% |
| Seattle, WA | 38% |
| Port St. Lucie, FL | 35% |
| Hartford, CT | 35% |
| Orlando, FL | 35% |
| Poughkeepsie, NY | 35% |
| Fort Myers, FL | 33% |
| Washington DC-VA-MD-WV | 22% |
| Denver, CO | 20% |
| Columbus, OH | 20% |
| Albany, NY | 19% |
| Portland, OR-WA | 19% |
| New Haven, CT | 18% |
| Grand Rapids, MI | 18% |
| Phoenix, AZ | 18% |
| Harrisburg, PA | 16% |
| Indianapolis, IN | 15% |
| Omaha, NE-IA | 14% |
| Lakeland, FL | 14% |
| Daytona Beach, FL | 14% |
| Tampa, FL | 13% |
| San Diego, CA | 13% |
| Austin, TX | 12% |
| Dallas-Fort Worth, TX | 12% |
| Houston, TX | 12% |
| Baltimore, MD | 12% |
| Atlanta, GA | 11% |
| Philadelphia, PA-NJ-DE-MD | 11% |
| Nashville, TN | 10% |
| San Francisco, CA | 10% |
| Kansas City, MO-KS | 10% |
| Greensboro, NC | 9% |
| Las Vegas, NV | 9% |
| Louisville, KY-IN | 8% |
| Buffalo, NY | 8% |
| Rochester, NY | 8% |
| Raleigh, NC | 8% |
| Los Angeles, CA | 8% |
| Cincinnati, OH-KY-IN | 8% |
| Durham, NC | 7% |
| Sacramento, CA | 7% |
| Jacksonville, FL | 7% |
| San Antonio, TX | 6% |
| Pittsburgh, PA | 6% |
| Charlotte, NC-SC | 6% |
| Riverside, CA | 6% |
| Tulsa, OK | 6% |
| Chicago, IL-IN | 5% |
| Richmond, VA | 5% |
| Killeen, TX | 5% |
| Oklahoma City, OK | 5% |
| St. Louis, MO-IL | 4% |
| Akron, OH | 4% |
| Milwaukee, WI | 4% |
| Fayetteville-Pinehurst, NC | 4% |
| Virginia Beach, VA-NC | 4% |
| Pensacola, FL | 4% |
| Savannah-Statesboro, GA | 3% |
| Winston-Salem, NC | 3% |
| Dayton, OH | 3% |
| Charleston, SC | 3% |
| Cleveland, OH | 3% |
| New Orleans, LA | 3% |
| Toledo, OH | 2% |
| Greenville, SC | 2% |
| Columbia, SC | 2% |
| Huntsville, AL | 2% |
| Detroit, MI | 2% |
| Chattanooga, TN-GA | 2% |
| Augusta, GA-SC | 2% |
| Columbus-Auburn, GA-AL | 2% |
| Baton Rouge, LA | 2% |
| Mobile-Fairhope, AL | 1.3% |
| Birmingham, AL | 1.1% |
| Memphis, TN-MS-AR | 1.0% |
| Beaumont-Port Arthur, TX | 1.0% |
| Montgomery, AL | 0.9% |
| Little Rock, AR | 0.8% |
| Lafayette-Opelousas, LA | 0.6% |
| Shreveport, LA | 0.6% |
| Macon-Bibb, GA | 0.6% |
| Jackson, MS | 0.2% |
Source: U.S. Census Bureau, 2023 American Community Survey 1-Year Estimates
Excludes Metropolitan areas with Black populations less than 65,000