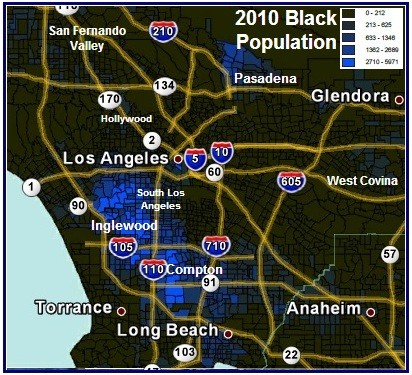
Los Angeles-Long Beach-Santa Ana, CA   Metropolitan Statistical Area
Use this menu to find out more about African American statistics

Home      Middle Class     Employment     Housing/Poverty      Education 

Health       Crime       Geography

Atlanta     Dallas    Contact Us    Black Links

Blueprint of Black America
Main Menu
Search BlackDemographics.com
Web site designed & administered by Akiim DeShay © 2007- 2008
Total population
Male
Female
Median age (years)

Under 18 years
Male
Female

18 years and over
Male
Female
1,009,597
47.0%
53.0%
33.7

283,472
50.8%
49.2%

726,125
45.6%
54.4%
HOUSEHOLDS BY TYPE
Households
Family households
With own children under 18 years

Married-couple families
  With own children under 18 years

Female, no husband present
  With own children under 18 years

Nonfamily households
Male householder
  Living alone

Female householder
  Living alone

Average household size
Average family size

364,090
57.8%
29.6%

24.4%
10.8%

27.2%
15.6%

42.2%
18.8%
16.3%

23.4%
21.5%

2.51
3.39
MARITAL STATUS.
Population 15 years and over
Now married, except separated
Widowed
Divorced
Separated
Never married

Male 15 years and over
Now married, except separated
Widowed
Divorced
Separated
Never married

Female 15 years and over
Now married, except separated
Widowed
Divorced
Separated
Never married
781,360
26.5%
6.0%
13.6%
4.3%
49.5%

358,916
31.9%
2.2%
11.3%
3.4%
51.3%

422,444
22.0%
9.3%
15.6%
5.0%
48.0%
EDUCATIONAL ATTAINMENT
Population 25 years and over
Less than high school diploma
High school graduate (includes equivalency)
Some college or associate's degree
Bachelor's degree
Graduate or professional degree

High school graduate or higher
Male, high school graduate or higher
Female, high school graduate or higher

Bachelor's degree or higher
Male, bachelor's degree or higher
Female, bachelor's degree or higher
611,967
13.2%
27.2%
36.4%
15.2%
8.0%

86.8%
87.0%
86.7%

23.3%
23.1%
23.4%
8,198,397
23.0%
22.3%
24.7%
19.7%
10.2%

77.0%
77.2%
76.8%

30.0%
31.6%
28.4%
EMPLOYMENT STATUS
Population 16 years and over
In labor force
Civilian labor force
Employed
Unemployed
Percent of civilian labor force
Armed Forces
Not in labor force
762,971
61.3%
61.2%
55.2%
6.0%
9.8%
0.1%
38.7%
9,922,970
64.8%
64.7%
60.8%
3.9%
6.0%
0.1%
35.2%
COMMUTING TO WORK
Workers 16 years and over
Car, truck, or van - drove alone
Car, truck, or van - carpooled
Public transportation (excluding taxicab)
Walked
Other means
Worked at home
Mean travel time to work (minutes)
405,194
74.7%
7.8%
9.5%
2.3%
1.7%
4.0%
31
5,853,958
74.0%
10.9%
6.1%
2.6%
2.0%
4.4%
28.6
Civilian employed population 16 years and over
Management, professional, and related occupations..................
Service occupations................................................................
Sales and office occupations...................................................
Farming, fishing, and forestry occupations.................................
Construction, extraction, maintenance, and repair occupations...
Production, transportation, and material moving occupations......

Male civilian employed population 16 years and over.........
Management, professional, and related occupations...................
Service occupations................................................................
Sales and office occupations...................................................
Farming, fishing, and forestry occupations.................................
Construction, extraction, maintenance, and repair occupations..
Production, transportation, and material moving occupations......

Female civilian employed population 16 years and over....
Management, professional, and related occupations..................
Service occupations................................................................
Sales and office occupations...................................................
Farming, fishing, and forestry occupations................................
Construction, extraction, maintenance, and repair occupations...
Production, transportation, and material moving occupations......

420,820
35.0%
20.0%
31.8%
0.1%
4.9%
8.2%

196,172
31.8%
19.6%
25.0%
0.2%
10.1%
13.4%

224,648
37.7%
20.4%
37.7%
0.1%
0.4%
3.7%
6,036,838
34.9%
17.0%
26.5%
0.2%
8.5%
12.9%

3,363,366
32.9%
14.8%
19.8%
0.3%
14.9%
17.4%

2,673,472
37.4%
19.9%
34.9%
0.1%
0.5%
7.2%
INDUSTRY
Agriculture, forestry, fishing and hunting, and mining................................................
Construction.......................................................................................................
Manufacturing.....................................................................................................
Wholesale trade...................................................................................................
Retail trade.........................................................................................................
Transportation and warehousing, and utilities..........................................................
Information...........................................................................................................
Finance and insurance, and real estate and rental and leasing..................................
Professional, scientific, management, administrative, waste management services......
Educational services, and health care and social assistance.....................................
Arts, entertainment, and recreation, and accommodation and food services.................
Other services (except public administration)............................................................
Public administration.............................................................................................
0.2%
2.8%
5.5%
2.0%
10.1%
8.5%
4.9%
8.3%
11.1%
27.3%
7.2%
4.9%
7.1%

0.3%
7.1%
12.2%
3.9%
10.5%
4.8%
3.9%
8.1%
12.5%
18.2%
9.6%
5.7%
3.1%


CLASS OF WORKER
Private wage and salary workers
Government workers
Self-employed workers in own not incorporated business
Unpaid family workers
71.3%
22.6%
6.1%
0.0%

78.9%
11.5%
9.4%
0.2%

INCOME IN THE PAST 12 MONTHS (IN 2006 INFLATION-ADJUSTED DOLLARS)

Households364,090    4,158,616
Median household income (dollars) 40,946       58,047
10,122,961
46.1%
5.3%
8.8%
2.8%
37.0%

4,983,733
48.3%
2.0%
7.1%
2.2%
40.4%

5,139,228
44.0%
8.5%
10.3%
3.4%
33.8%
4,158,616
68.1%
34.6%

47.7%
24.3%

14.0%
7.6%

31.9%
15.3%
11.4%

16.7%
14.0%

3.04
3.7
12,875,587
49.6%
50.4%
34.8

3,348,783
51.2%
48.8%

9,526,804
49.1%
50.9%
OCCUPATION
Los Angeles
California
LA METRO
Black(local)   Los Angeles   Black USA
All statistics above are from the Census Bureau - 2007 American Community Survey
39,663,004
47.8%
52.2%
30.3

12,237,882
51.0%
49.0%

27,425,122
46.4%
53.6%
13,672,045
63.9%
34.6%

28.7%
13.4%

29.1%
18.2%

36.1%
16.4%
13.8%

19.7%
17.8%

2.66
3.4
29,594,243
30.5%
6.2%
11.5%
4.6%
47.2%

13,833,820
34.7%
2.7%
9.8%
3.8%
49.1%

15,760,423
26.8%
9.3%
13.1%
5.2%
45.6%
22,841,743
19.7%
34.1%
28.7%
11.6%
5.9%

80.3%
79.3%
81.2%

17.5%
16.0%
18.7%
28,864,386
62.9%
62.4%
54.9%
7.5%
12.0%
0.5%
37.1%
15,411,803
71.1%
10.5%
11.5%
2.9%
1.7%
2.3%
27.7
15,835,609
27.0%
24.1%
26.6%
0.3%
6.1%
15.9%

7,350,655
22.0%
20.6%
19.2%
0.5%
12.5%
25.3%

8,484,954
31.3%
27.1%
33.1%
0.1%
0.6%
7.8%
0.5%
3.9%
9.6%
2.1%
10.8%
7.6%
2.6%
6.5%
8.7%
27.2%
9.1%
4.3%
7.0%
76.2%
20.0%
3.7%
0.1%
13,672,045
34,169
Black(local)   Los Angeles   Black USA
Black(local)     Los Angeles        Black USA
Black(local)       Los Angeles        Black USA
Black(local)     Los Angeles       Black USA
Black(local)   Los Angeles  Black USA
Black(local)     Los Angeles      Black USA
Black(local)     Los Angeles         Black USA
  Black(local)   Los Angeles    Black USA
  Black(local)   Los Angeles     Black USA
City Statistics
State Statistics
Resourses
My Other Sites
Los Angeles has the 5th largest Black population in the United States. African Americans migrated to California mainly during the 2 great Black migrations from the South. Although the migration moved most northward, thousands of Blacks from the central southern states  like Louisiana, East Texas, and Arkansas moved west to the Golden State for better lives and
opportunities. The majority of African Americans in this metropolitan area live south of downtown in adjacent neighborhoods and cities. The neighborhoods of Los Angeles include Baldwin Hills, South Los
Angeles (formerly South Central), and Watts. And also the cities of Compton, Carson, Inglewood and Long Beach.

The migration pattern from Los Angeles has followed the same pattern as the urban areas of the Northeast and Midwest. Many who are able and/or educated have left for the south seeking better opportunities and a higher standard of living.