

African Americans & Crime
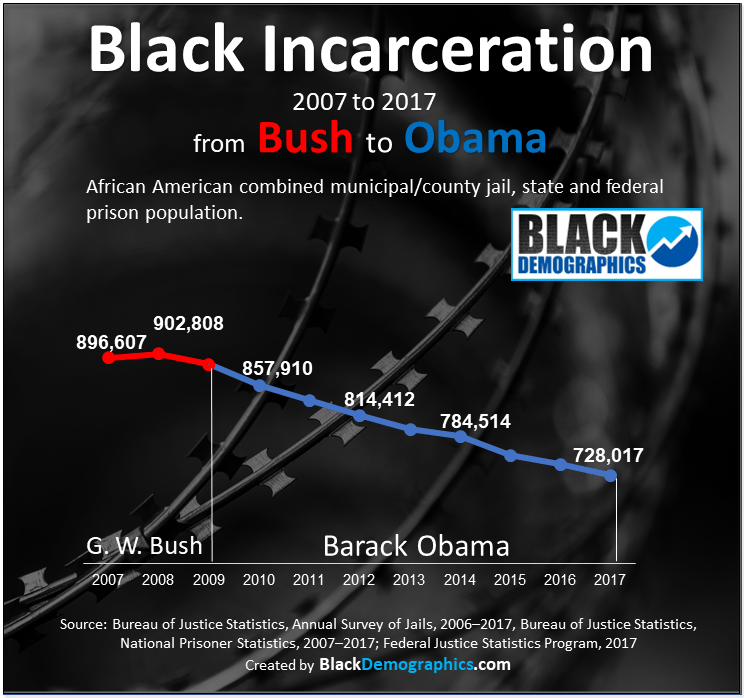
The chart above shows the decline of the overall incarceration of African Americans in the United States from its all time peak in 2008. As the chart shows the decrease began during the last year of the Bush administration and continued during the entire 8 years of the Obama administrations ending the beginning of 2017. Data during the Trump administration was not available at the time of this chart. Totals incarcerated on this chart includes state and federal prison populations as well as those being held in local county and municipal jails.
In 2017 there were 728,017 incarcerated African Americans, 475,900 in State and federal prisons and 250,100 in local, county and municipality jails.
NOTE: Those being held in local, county and municipal jails are not all convicted of crimes. Many are awaiting trial or to be bonded out after being arrested.
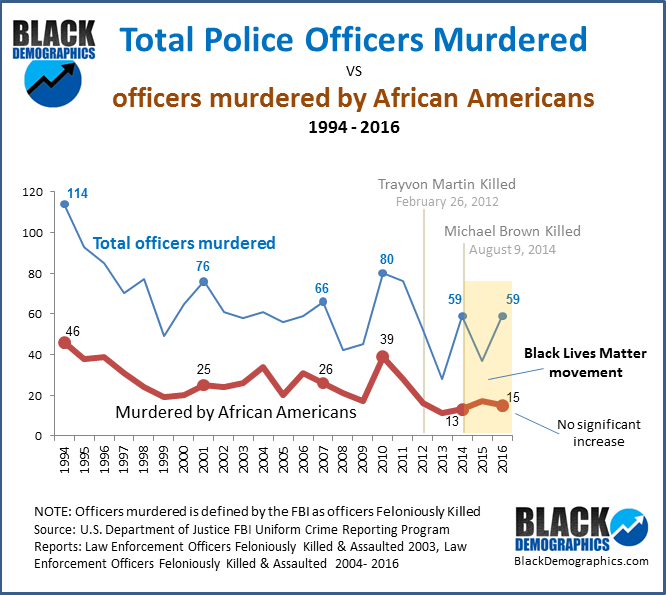
According to Data provided by the United States DOJ/FBI Uniform Crime Reporting Program, the number of police officers murdered declined from the 1990s.
Despite the media attention paid to protests related to Trayvon Martin in 2012 and Micheal Brown in 2014 which sparked the Black Lives Matter movement the number of murdered police officers remained well below the numbers in the 90s. In 1994 they recorded 114 police officers murdered (feloniously killed) but in 2016 the number dropped to 59. Of those 59 only 15 were killed by African Americans.
As a matter of fact the number of officers murdered by African Americans remained at its lowest during the Black Lives Matter movement between 13 and 15 a year.
Stopped, Searched, & Arrested
Every few years an incident occurs in the Black community where a Black man is handled with excessive force or is shot to death by police. The confrontation may be taped or due to the surrounding circumstances the African American community and sometimes the media will rally behind the alleged victim and demand justice.
When this occurs the age-old question resurfaces about whether or not Black men are unfairly targeted by law enforcement.
In 2005 the U.S. Department of Justice ‘Bureau of Justice Statistics’ released a report titled ‘Contacts between Police and the Public: Findings from the 2002 National Survey’. This was a sampling of 80,000 Americans that collected information regarding traffic stops and the circumstances surrounding contact with police. The report found that:
9% of White drivers were stopped
9% of Black drivers were stopped
9% of Hispanic drivers were stopped
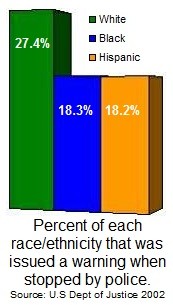
However, African Americans, and Hispanics were much less likely to be issued a simple traffic warning from police during these traffic stops and were much more likely to be searched (person or vehicle), handcuffed, and arrested.
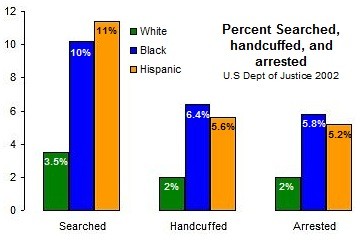 Percent Searched, Handcuffed, and Arrested
Even though the same percentage of Whites, Blacks, and Hispanics were stopped by police (9%), African Americans were:
- three times more likely to to be searched (person or vehicle) than Whites
- more than three times more likely to be handcuffed
- almost three times more likely to be arrested.
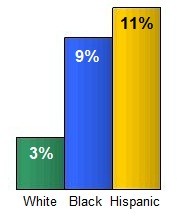
Percent Searched but Not Arrested
Another report released from the U.S. Department of Justice noted that during the same year 9% of the Black men who were stopped and not arrested had been searched compared to 3% of White men. Hispanics were the only group searched without being arrested more than African Americans.
INCARCERATION
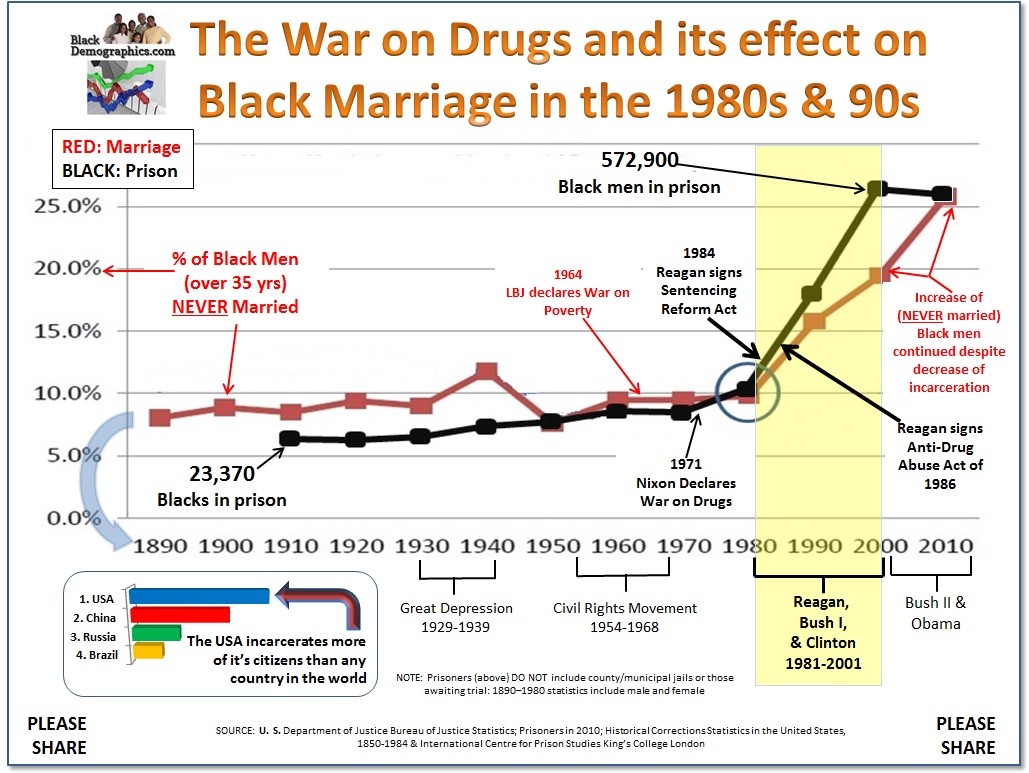
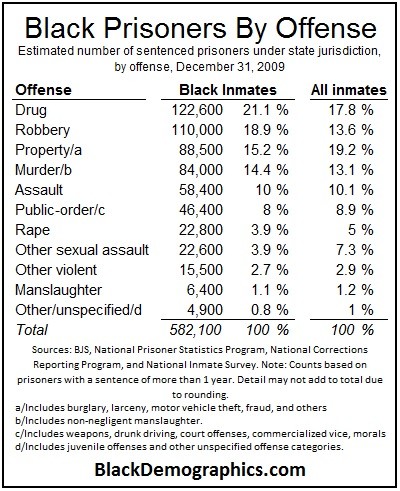
According to the US Department of Justice more African Americans have sentences for drug convictions (of more than one year) in state prisons than any other offense. Approximately 122,600 Blacks were under state jurisdiction for drugs accounting for 21.1% of all Black state inmates in December 2009. This is higher than the 17.8% of all inmates incarcerated for drug offenses. Robbery was the cause for the second largest percentage of Black inmates with 18.9%, followed by property crimes which include burglary, larceny, motor vehicle theft, and others at 15.2%. Murder convictions were responsible for 14.4% of African Americans in state prisons.
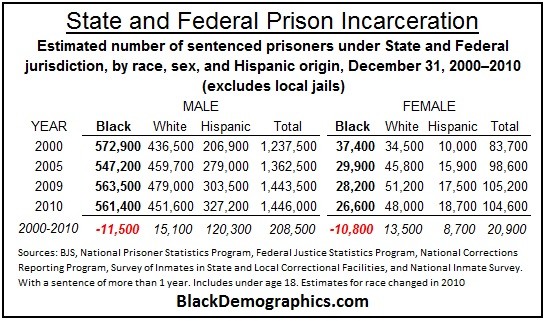
The number of Black Men and Women in State and Federal prison declined by more than 20,000 between 2000 and 2010 while the total White incarceration increased by 28,600. Hispanic incarceration experienced the largest gain increasing by 129,000 during the same time period.
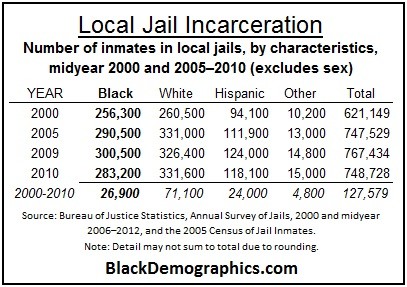
Of the approximately 127,500 increase in Local Jail population between 2000 and 2010, only 26,900 were African American which was much less than the 71,100 increase of Whites to Local Jails. The Hispanic population increase of 24,000 was the lowest during the same time period.